ABSTRACT
INTRODUCTION Mortality analysis based on a single cause of death is not, in most cases, fully informative. There are several more illuminating procedures using a multiple cause of death approach; these are little known and rarely used in Cuba. The simplest of these methods, while methodologically limited, consists of summing all deaths from a specific cause mentioned on death certificates, regardless of whether the cause is listed as underlying or contributing.
OBJECTIVE Using Cuban data, critically assess and implement two of the most recognized approaches to analyzing multiple causes of death.
METHODS Multiple causes of death in Cuba were assessed for the years 2005, 2010 and 2015, employing death records from the National Medical Records and Health Statistics Bureau of Cuba’s Ministry of Public Health. With the example of diabetes mellitus as underlying cause, we explored connections between underlying and associated (antecedent and contributing) causes on death certificates using two approaches from the international literature: the simple method and the cause-of-death association indicator.
RESULTS The study identified main trends in multiple causes of death identified in 2005, 2010 and 2015, overall and by age group and sex. We observed a trend to increasing mean number of causes of death per death certificate between 2005 and 2015. The number of causes reported showed no substantial differences by age group or sex. Diseases of the arteries, arterioles and capillaries were by far the most frequently associated with diabetes mellitus as underlying cause.
CONCLUSIONS The multiple causes of death approach affords more nuanced understanding of patterns of disease, comorbidity and death in the Cuban population. The indicators used fulfill different roles: the simple method brings to light the full range of ways in which a given cause contributes to mortality, and the cause-of-death association indicator enables exploration of links between different causes of death, not possible with the simple method.
KEYWORDS Mortality, multifactorial causality, causes of death, diabetes mellitus, Cuba
INTRODUCTION
Historically, mortality analysis uses a single underlying cause. But this one-dimensional, single-cause approach has long been considered inadequate for studying mortality patterns, especially when analysis spans geography and time.[1–3] A more nuanced mortality analysis would provide important information about population health status and priorities for prevention and treatment options, as well as projections for the mid and long term.
Other areas of epidemiology approach etiological problems in a more comprehensive and multidimensional fashion.[4] For example, in the case of causal attribution for a health event such as morbidity from cause j, it is standard procedure to consider various (k) risk factors “j1, j2”, …, jk” as causal.[5] In the case of mortality, unicausal analyses can be justified by the ease and convenience of the ICD-10 algorithm, which identifies the underlying cause as the most important one,[6] but the fact that the underlying cause may eventually be determined to be the most important does not mean that it is the sole cause. Nor is it advisable to ignore the others.
Various methods have been used for analyzing mortality in terms of multiple causes of death (MCD), all of which make use of death certificate entries of causes besides the underlying one.[7–10] Some, known as intermediate or antecedent causes, are part of the chain of events leading to death initiated by the underlying cause and are included in Part I. Others are contributing causes unrelated to the causal chain and are listed in Part II of the death certificate.[2,7] Information in Parts I and II about whether causes are intermediate parts of the causal chain or merely contributing causes may be omitted when death certificates are digitized, which means that, in practical terms, all causes of death—underlying and intermediate—are lumped together. Hereafter, when intermediate and contributing causes are referred to together, they will be described as associated or non underlying causes.
IMPORTANCE The article demonstrates the utility of a multidimensional approach to analyzing mortality data to better understand the complex associations among conditions leading to death.
The most frequently used MCD method, and one of the simplest, consists of calculating mortality from cause i by counting all death certificate mentions of cause i, whether underlying or associated.[9] An important limitation of this method (which we will call the simple method), is that deaths with k associated causes are counted k times, which distorts the total number of deaths for a given time period and place (that is, deaths are counted for every associated cause mentioned, so a death with six conditions mentioned on the death certificate would look like six deaths when causes are summed).
One can avoid this limitation by assigning weighted values (summing to unity) to different causes of death within a single death certificate.[10] The main virtue of weighted methods is that they bring to light causes that are rarely reported as underlying causes but are frequently reported as intermediate or contributing causes. In contrast, analysis based solely on underlying causes completely ignores intermediate and contributing causes.
The MCD approach presents as-yet-unexplored possibilities.[11] Two of the most promising are described below:
- Cluster analysis to identify mortality patterns.[2,7,9] Such analyses can be designed in different ways. One consists of considering cause i as a fixed underlying cause.[12] This analysis can be repeated for different years, provinces, or municipalities, to assess pattern stability over time and place.
- Regression models to assess diseases as risk factors for given underlying causes.[13,14] Death records provide sufficient information on multiple causes for this approach to derive inferences regarding which diseases constitute important risk factors for a given underlying cause.
- The cause of death association indicator (CDAI),[8] one of the most interesting among various MCD approaches.[2,7,8,12] Important correlations between causes of death provide information about causal patterns, for example a pattern in which a particular group of causes is shared by a relatively large number of deaths. If deaths in a specific place and time could be grouped into a small number of patterns, health interventions could be organized around these patterns, which would facilitate the work of health decision-makers.
CDAI is interesting because it assesses the “true” impact of a disease associated with an underlying cause of death, since it quantifies the observed relative to the expected association. This correction is common in statistical indicators, as in the cases of relative risk and the Kappa coefficient, the former adjusted to a reference risk category/value of reference,[15] and the latter to random inter-rater agreement.[16]
Repeated application of CDAI to a potentially long list of diseases a1, a2, …, ak associated with an underlying cause b would enable detection of those that correlate most strongly with b, and perhaps, under specific conditions, those that best “explain” deaths by underlying cause b. In this context, it would undoubtedly be useful to employ a multivariate procedure to complement CDAI and somehow adjust the effect (association) of ai (with b) to the effect (association) of aj (with b), for i, j = 1, …, k; i ≠ j. To date, we do not know of any such multivariate procedure.
MCD approaches to analyze death certificates are rare internationally and quite limited in Cuba. The usual practice in Cuba is to analyze underlying and contributing causes separately, without exploring their connections.[17,18]
This study aimed to review and implement two of the most important MCD procedures, using Cuban data from death certificates listing diabetes mellitus (DM) as a cause of death. DM is a chronic disease of increasing impact internationally and in Cuba,[19–21] where it has ranked among the 10 main causes of death for all ages since the end of the 1960s.[22] We focused on DM because it is most frequently listed on death certificates as a contributing cause of death and can thus be used to illustrate the impact of employing MCD methods versus the traditional approach using only underlying causes.
METHODS
A descriptive study was conducted using data from the mortality database of the National Medical Records and Health Statistics Bureau of Cuba’s Ministry of Public Health (DNE/MINSAP) for 2005, 2010 and 2015 (84,817; 91,060 and 99,684 deaths respectively). Deaths for which no age was reported were excluded (7, 5 and 7 in 2005, 2010 and 2015, respectively). Sex was recorded on all death certificates.
Multiple causes of death were described in terms of the proportion of deaths for which >1 cause was reported, and mean number of causes reported per death, overall and by age group (<1 year, 1–4 years, 5–9 years . . . up to 85–89 years, ≥90 years). These indicators are widely used in the MCD literature.[13]
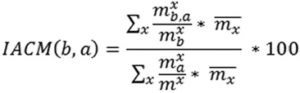
The simple method, which counts all deaths for which a given associated cause is mentioned (whether underlying or contributing), was applied to DM mortality utilizing ICD-10 codes E10–E14.[6] Among the more sophisticated methods available that combine underlying and intermediate or contributing causes[23] is CDAI, proposed by Désesquelles in 2010 to quantify the relative association between a contributing cause a and an underlying cause b, and between the contributing cause a and any underlying cause.[8] In formal terms, it is defined as the ratio between two standardized proportions:
- prevalence at time of death of a specific combination between a contributing cause a and an underlying cause b, among all deaths with b as underlying cause; and
- prevalence at time of death of the same contributing cause among all deaths by any cause, expressed as follows:
where
 = number of observed deaths in age group x with underlying cause b and contributing cause a
-
 = number of observed deaths with underlying cause b in age group x
 = total number of observed deaths in age group x with contributing cause a (independent of underlying cause)
 = total number of observed deaths in age group x
 = mean deaths in age group x, in locations (countries, regions, zones, etc.) used to calculate the indicator, used as a standardizing reference.[8]
Given that this study did not compare CDAI for different regions, places or time periods (except 2015) with mortality patterns by age, standardization was not necessary. Thus, in expression (1) the proportions were calculated overall and not by age group, and the factor was not applied.
To illustrate this, CDAI was applied to the four contributing causes that most frequently appear with deaths citing DM as the underlying cause:[1,5] circulatory diseases (essential hypertension, code 110X); diseases of arteries, arterioles and capillaries (DAAC, code 179.2); respiratory diseases (codes J15.9 and J18.2), and glomerular and renal diseases (codes N08.3 and N18.9).[6]
Ethics This study was a component of the Disease Burden and Risk Factors in Cuba:1990–2015 project and was approved by the Scientific Council and Ethics Committee of the National Hygiene, Epidemiology and Microbiology Institute, as part of a collaboration between the latter and the Institute of Tropical Medicine (Antwerp, Belgium).
RESULTS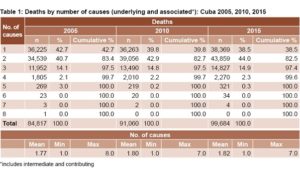
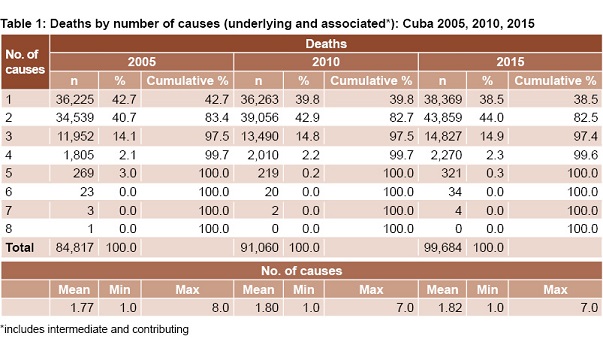
Table 1 shows the mean numbers of causes noted on 2005, 2010 and 2015 death certificates overall. A total of 42.7% of certificates noted only the underlying cause in 2005, the corresponding proportions for 2010 and 2015 being 39.8% and 38.5%, respectively. There was a slight increase in the number of causes reported over the period: the mean number of causes recorded was 1.77 in 2005, 1.8 in 2010, and 1.82 in 2015.
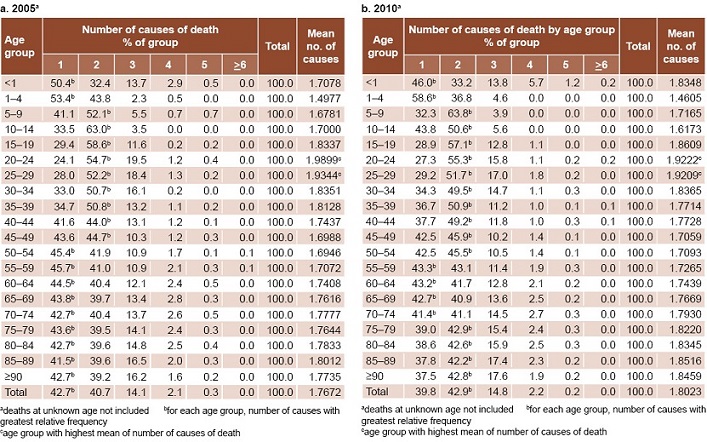
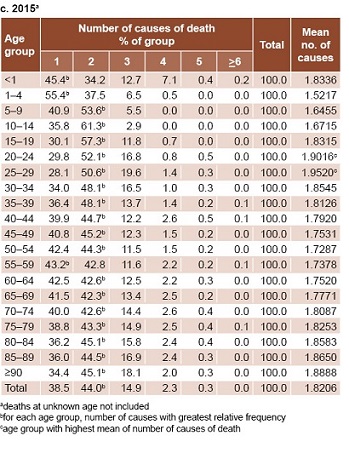
Table 2: Number of causes of death by age group: Cuba 2005, 2010, 2015
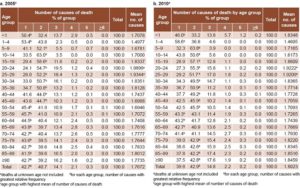
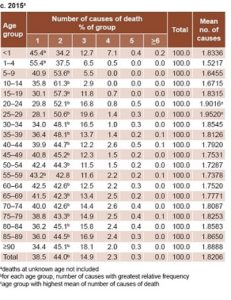 Table 2 displays the proportions of each age group for which a given number of causes were reported on death certificates in all three years studied. In 2005, the reporting of two causes of death was slightly more frequent for ages 5–49 years than for other age groups, in which a single cause predominated. Tables 2b and 2c (2010 and 2015) indicate that over time the number of age groups with two causes of death increased.
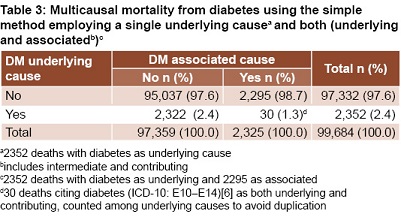
Table 3 presents a cross tabulation of DM as a single 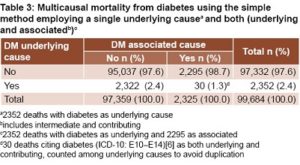 underlying cause (traditional approach) and DM as including both contributing and underlying causes (simple MCD method), both as dichotomous variables. Using the simple MCD method, DM deaths for 2015 were almost twice the proportion obtained by the traditional, single-cause approach, 4.7% of all deaths vs. 2.4%, respectively.
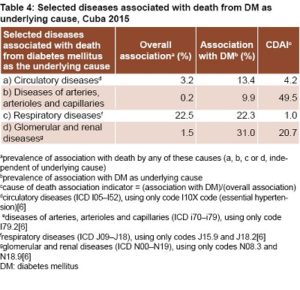
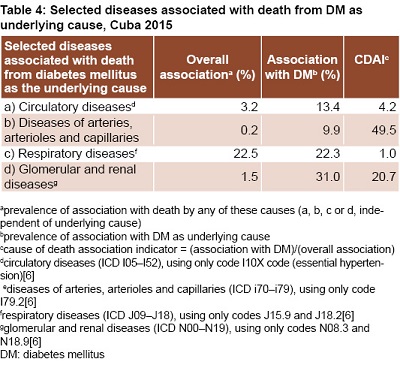
Finally, Table 4 presents the results using CDAI to adjust for nonunderlying causes’ baseline association with deaths overall. Results are displayed for the four causes listed most frequently as associated with DM when DM is recorded as the underlying cause of death: a) circulatory diseases; b) diseases of arteries, arterioles and capillaries; c) respiratory diseases; and d) glomerular and renal diseases.
DISCUSSION
The percentages for the association of each of these disease groups with DM as the underlying cause (second column) are potentially biased. According to these figures, it could be concluded that respiratory diseases, and glomerular and renal diseases, are the groups that most strongly correlate with deaths from DM (as the underlying cause), and that diseases of arteries, arterioles and capillaries have a low correlation. Under specific assumptions, these correlations could be interpreted as if the first two disease groups are those that best explain or predict mortality attributed to DM (as the underlying cause) and that DAAC is the group that explains or predicts the least.
This is an erroneous interpretation in the case of respiratory diseases, as it ignores the fact that this disease group appears very frequently as a contributing cause overall, independent of underlying cause of death. It is also erroneous in the case of DAAC, insofar as it ignores that these diseases rarely appear as a contributing cause of death independent of the underlying cause.
The last column of Table 4 is the one that brings us closest to understanding the “true” association between the four disease groups and DM as underlying cause of death. CDAI is close to 50 for DAAC, which suggests that, on the rare occasions when DAAC is associated with an underlying cause of death, it is almost always DM. Stated another way, DAAC is associated with DM as underlying cause of death 50 times more often than it is associated with deaths overall.
Studies using MCD approaches to analyze mortality patterns are rare,[3,8,24,25] and even more so in Cuba.[17,18,26]
The numbers of causes reported in death certificates in Cuba for the years studied were significantly lower than reported in a 1998 Cuban study,[26] and there was a higher proportion of death certificates citing a single, underlying cause compared to results from developed countries.[27] Some authors hold that death certificates reporting multiple causes of death generate more useful information.[27] From that vantage point, our observation of a trend toward reporting more causes over the later of the three years studied is encouraging.
International authors have proposed that the number of causes of death reported in death certificates should be higher for older adults than for people dying at younger ages,[11,17,27] given the complexity of disease processes leading to death in older adults.[12] We did not observe this pattern in Cuba. On the contrary, in all three years analyzed, the mean number of causes reported for people aged 20–29 years was slightly higher than for other age groups. To our knowledge, this pattern has not been reported.
It should be noted that traditional mortality analysis based on one underlying cause is in fact a weighted MCD approach, in that it assigns a value of 1 to the underlying cause and 0 to the remaining causes.
The simple MCD method is one of the most frequently used.[28] However, it is essentially univariate, because it counts a single cause regardless of where it is mentioned on the death certificate. A truly multivariate approach would look for patterns of association and clustering.
Proponents of the simple method would argue that it “retrieves” the 2295 deaths where DM is not listed as an underlying cause but is listed as a contributing cause. However, the total appropriation of these 2295 deaths ignores the fact that some or many of these would be double counted, since some or many of these would also be counted as associated with other causes. Thus this may lead to biased estimations of the relative impact of associated causes and hence does not permit a summary assessment of the relative impact of individual causes on all deaths.
CDAI has been used to explore the impact of cancer as the underlying cause.[9] A 2010 study used CDAI to identify subgroups of diseases according to their relative position in the causal chain. In particular, it stated the hypothesis that there are different morbidity processes at work when DM is the underlying cause and circulatory diseases are contributing causes, than when heart disease is the underlying cause and DM is a contributing cause.[8]
It should be noted that CDAI’s utility is independent of the absolute frequency of a particular contributing cause among deaths from the underlying cause under study (DM, in this case). In other words, analysis could well have included more than the four groups of causes we chose.
As far as we know, no other study to date has used CDAI to reassess the roles of contributing causes when DM is the underlying cause.
This study did not aim to exhaust the topic but reviewed two multicausal methods that respond to different objectives. It also considered a limited number of causes associated with DM as an underlying cause. In our opinion, this is sufficient to demonstrate the importance of the CDAI method. However, a more thorough approach to DM would contextualize it within a broader group of causes associated with DM as an underlying cause and include analysis of other noncommunicable chronic diseases.
CONCLUSIONS
The multiple causes of death approach affords more nuanced understanding of patterns of disease, comorbidity and death in the Cuban population. The indicators used fulfill different roles: the simple method brings to light the full range of ways in which a given cause contributes to mortality, and the cause-of-death association indicator enables exploration of links between different causes of death, not possible with the simple method.
ACKNOWLEDGMENTS
The authors thank DNE/MINSAP for providing access to the mortality database used in this study.
References

- Dorn HF, Moriyama IM. Uses significance of multiple cause tabulations for mortality statistics. Am J Public Health Nations Health. 1964 Mar;54:400–6.
- Broderick JB. Classification of multiple causes of death. J Statistical Soc Inquiry Society Ireland. 1955;XXIX:159–82.
- Fedeli U, Zoppini G, Goldoni CA, Avossa F, Mastrangelo G, Saugo M. Multiple causes of death analysis of chronic diseases: the example of diabetes. Popul Health Metr. 2015 Aug 25;13(21).
- Maldonado G, Greenland S. Estimating causal effects. Int Journal Epidemiol. 2002 Apr;31(2):422–9.
- Lopez AD, Mathers C, Ezzati M, Jamison D, editors. Global Burden of Disease and Risk Factors. New York: Oxford University Press; 2006.
- World Health Organization. International Statistical Classification of Diseases and Related Health Problems (ICD): 10th Revision. Version 2015 [Internet]. Geneva: World Health Organization; 2007 [cited 2018 Jul 1]. Available from: http://apps.who.int/classifications/icd10/browse/2015/en
- Koch TM. Multiple Underlying Causes of Death using Montana Death Certificates, 1999–2014 [Internet]. Montana: Office of Epidemiology Scientific Support; 2015 Dec [cited 2017 Jan 23]. 7 p. Available from: https://dphhs.mt.gov/Portals/85/publichealth/documents/Epidemiology/VSU/VSU_Multiple_Cause_2017.pdf
- Désesquelles AF, Salvatore MA, Frova L, Pace M, Pappagallo M, Meslé F, et al. Revisiting the mortality of France and Italy with the multiple cause-of-death approach. Demographic Res. 2010 Oct 26;23(28):771–806.
- Désesquelles A, Salvatore MA, Pappagallo M, Frova L, Pace M, Meslé F, et al. Analyzing multiple causes of death: which methods for which data? An application to the cancer-related mortality. Eur J Population. 2012 Nov;28(4):467–98.
- Piffaretti C, Moreno-Betancourt M, Lamarche-Vadel A, Rey G. Quantifying cause-related mortality by weighting multiple causes of death. Bull World Health Organ. 2016 Dec 1;94(12):870–9.
- Abu-shakra M, Novack V. Mortality and multiple causes of death in systemic lupus erythematosus −− Role of the death certificate mortality. J Rheumatol. 2012 Mar;39(3):458–60.
- Pink B. Information Paper: Causes of Death Certification. Australia 2008 [Internet]. Canberra: Australian Bureau of Statistics; 2008 Nov 25 [cited 2017 Jan 23]. 36 p. Available from: http://www.ausstats.abs.gov.au/ausstats/subscriber.nsf/0/475BC02643DB45EDCA25750B000E38A4/$File/1205055001_2008.pdf
- Frova L, Salvatore MA, Pappagallo M, Egidi V. The multiple cause of death approach to analyze mortality patterns. 2009 May–Sep;65(1):1–21.
- Wall MM, Huang J, Oswald J, McCullen D. Factors associated with reporting multiple causes of death. BMC Med Res Methodol. 2005 Jan 17;5(1):4.
- Woodward M. Epidemiology: Study Design and Data Analysis. London: Chapman & Hall; 1999 May 25.
- Altman DG. Section 14.3. In: Practical Statistics in Medical Research. 1st ed. London: Chapman & Hall; 1991.
- Hurtado de Mendoza Amat J, Álvarez Santana R, Borrajero Martínez I. Discrepancias diagnósticas en causas de muerte detectadas por autopsia. Cuba, 1994–2003. Segunda parte. Patolog Rev Panam. 2009 Apr–Jun;47(2):81–9. Spanish.
- Ygualada Correa Y, Hurtado de Mendoza Amat J, Montero González TJ. Las autopsias en el hospital Comandante Manuel Fajardo Rivero. Rev Cubana Med Militar. 2013;42(1):62–71.
- World Health Organization. Fact sheets: non-communicable diseases 2015 [Internet]. Geneva: World Health Organization; 2018 [cited 2017 Jan 20]. Available from:http://www.who.int/newsroom/factsheets/detail/noncommunicable-diseases
- Franjic B, Marwick TH. The diabetic, hypertensive heart : epidemiology and mechanisms of a very high-risk situation. J Hum Hypertens. 2009 Nov;23(11):709–17.
- Domínguez E, Seuc AH, Díaz O, Aldana D. La carga de la diabetes en Cuba. Período 1990– 2005. Rev Cubana Endocrinol. 2008 May–Aug;19(2). Spanish.
- Domínguez YA, Ruiz de León Y, Iglesias Marichal I, Martínez Morales MA, Mazorra Ramos V, Díaz Díaz O, et al. Discrepancia diagnóstica clínico-anatomopatológica de la diabetes mellitus como causa básica de muerte. Rev Cubana Endocrinol. 2017 May–Aug;28(2). Spanish.
- Park J, Peters PA. Mortality from diabetes mellitus, 2004 to 2008: a multiple-cause- of-death analysis. Health Rep. 2014 Mar;25(3):12–6.
- Bustamante Montes P, Lezama Fernández MA, Fernández de Hoyos R, Villa Romero AR, Borja Aburto VH. El análisis de la mortalidad por causa múltiple: un nuevo enfoque. Salud Pública Méx. 1990 May–Jun;32(3):309–19. Spanish.
- Ordobás Gavín M, Gandarillas A, Fernández de la Hoz Zeitier K, Fernández Rodríguez S. Mortalidad y tuberculosis: análisis por causas múltiples en la comunidad de Madrid. Rev Esp Salud Pública. 2003 Mar–Apr;77(2):189–200. Spanish.
- Ríos Massabot NE, Mesa Machado AC, Tejeiro Fernández A. Causas múltiples de muerte. Rev Cubana Hig Epidemiol. 1998;36(2):116–26. Spanish.
- Wilkins K, Wysocki M, Morin C, Wood P. Multiple causes of death. Health Rep. 1997 Autumn;9(2):19–29.
- Bustamante-Montes LP, Álvarez-Solorza I, Valencia AD, Hernández-Valero MA, Tlachino GT, Huidobro LG. Aplicabilidad del análisis por causa múltiple de muerte para el cáncer cervicouterino: La experiencia en México. Ciênc Saúde Colet [Internet]. 2011 Dec [cited 2017 Jan 25];16(12):4815–21. Available from: http://www.scielo.br/scielo.php?script=sci_arttext&pid=S14131232011001300030&lng=en&nrm=iso&tlng=en. Spanish.
THE AUTHORS
Armando H. Seuc Jo (Corresponding author: armandoseuc@infomed.sld.cu). Biostatistician, National Hygiene, Epidemiology and Microbiology Institute (INHEM), Havana, Cuba.
Lisbeth Fernández, nurse specializing in biostatistics, INHEM, Havana, Cuba.
Mayelin Mirabal Sosa, mathematician, Finlay Vaccine Institute, Havana, Cuba.
Armando Rodríguez Salva, physician with master’s degrees in epidemiology and health administration, INHEM, Havana, Cuba.
Carlos A. Rodríguez García, second-year resident in biostatistics, National School of Public Health, Havana, Cuba.
Submitted: January 09, 2018 Approved: July 06, 2018 Disclosures: None