ABSTRACT
INTRODUCTION Population aging translates into more people with chronic non-communicable diseases, disability, frailty and dependency. The study of frailty—a clinical syndrome associated with an increased risk of falls, disability, hospitalization, institutionalization and death—is important to improve clinical practice and population health indicators.
OBJECTIVES In a cohort of older adults in Havana and Matanzas provinces, Cuba, estimate prevalence of frailty and its risk factors; determine incidence of dependency; estimate mortality risk and identify mortality predictors.
METHODS A prospective longitudinal study was conducted door to door, from June 2003 through July 2011, in a cohort of 2813 adults aged ≥65 years living in selected municipalities of Havana and Matanzas provinces; mean followup time was 4.1 years. Independent variables included demographics, behavioral risk factors and socioeconomic indicators, chronic non-communicable diseases (hypertension, stroke, dementia, depression, diabetes, anemia), number of comorbidities, and APOE ε4 genotype. Dependent variables were frailty, dependency and mortality. Criteria for frailty were slow walking speed, exhaustion, weight loss, low physical activity and cognitive decline. Prevalence and frailty risk were estimated by Poisson regression, while dependency and mortality risks and their predictors were determined using Cox regression.
RESULTS Frailty syndrome prevalence was 21.6% (CI 17.9%–23.8%) at baseline; it was positively associated with advanced age, anemia and presence of comorbidities (stroke, dementia, depression, three or more physically debilitating diseases). Male sex, higher educational level, married or partnered status, and more household amenities were inversely associated with frailty prevalence.
In followup, dependency incidence was 33.1 per 1000 person-years (CI 29.1–37.6) and mortality was 55.1 per 1000 person-years. Advanced age, male sex, lower occupational status during productive years, dependency, frailty, dementia, depression, cerebrovascular disease and diabetes were all associated with higher risk of death.
CONCLUSIONS Given the challenge for developing countries presented by demographic and epidemiologic transition; the high prevalence in older adults of frailty syndrome, dependency and chronic non-communicable diseases; and the association of all these with higher mortality, attention should be targeted to older adults as a risk group. This should include greater social protection, age-appropriate health services, and modification and control of cardiovascular risk factors.
KEYWORDS Frail elderly, frail older adults, aged, elderly, dependency, mortality, chronic disease, dementia, Alzheimer disease, risk factors, Cuba
INTRODUCTION
Between 2000 and 2050 those aged >60 years will increase from 600 million to 2 billon, 22% of the global population; four-fifths of these older adults will live in Asia, Africa and Latin America.[1] Population aging compounds the current epidemic of chronic non-communicable diseases (NCD) and explains most of the disease burden suffered in these regions.[2,3] In 2005, there were 58.3 million deaths worldwide; more than half (30.6 million) were of persons aged ≥60 years; 60% (35 million) were related to NCDs, and 80% occurred in low- and middle-income countries.[4]
Furthermore, with rapid population aging, dependency—defined as the need for human help or frequent care beyond that required by a healthy adult—[5] acquires important social, economic and public health implications. By 2050, the number of dependent older adults will quadruple, while the number of dependent minors will remain steady.[5] Arthritis, dementia, stroke and depression (affecting the brain and mental health) are the main contributors to disability and dependency in older adults.[6,7] Such conditions receive lower priority than cardiovascular diseases and cancer, which have a higher impact on mortality.[8] Yet, in aging societies, a key challenge for public health and science is not only to “add years to life,” but also to improve quality of life and “add life to years.”[1]
As defined by Fried, frailty is a clinical syndrome stemming from an age-related decrease in muscle mass (sarcopenia) and progressive deregulation of biologic systems, and defined by presence of at least three of the following: exhaustion, unintentional weight loss, weakness, slow walking speed and low physical activity.[9] Other authors also include cognitive, behavioral or sensorial disorders.[10,11] Assessment of frailty has important applications in clinical practice (for risk stratification and both primary and secondary prevention) and in public health (for monitoring progress in improvement of population health indicators and for healthy aging).
In 2012, the Cuban population was 11,163,934; 18.3% were aged ≥60 years and life expectancy at birth was 78 years (76 for men and 80 for women). Life expectancy at 60 was 22.1 additional years, and at 80, 8.8 more years.[12] This supposes an increase in prevalence of frailty, older-adult dependency and diseases associated with aging; hence, reducing frailty, dependency, and aging-related disease morbidity and mortality is a challenge for the national health system.
This study is part of the 10/66 research program, a door-to-door population study conducted with a sample of 21,000 persons aged ≥65 years in 11 countries: 7 in Latin America (Brazil, Cuba, Mexico, Peru, Puerto Rico, the Dominican Republic and Venezuela), 2 in Asia (China and India) and 2 in Africa (Nigeria and South Africa).[13,14]
The main objectives of our study were to assess prevalence of frailty and its associated risk factors, to determine incidence of dependency, and to identify mortality risk and predictors in a population of adults aged ≥65 years living in Havana and Matanzas provinces, Cuba, from June 2003 through July 2011.
METHODS
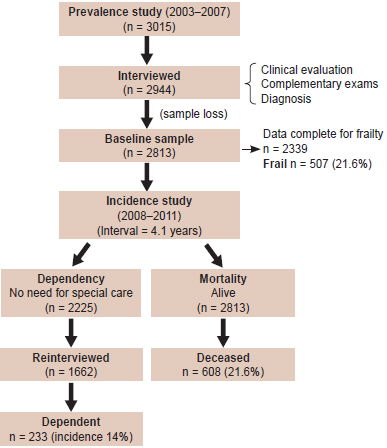
Study design In Cuba, the 10/66 study involved a cohort of adults aged ≥65 years in selected areas of Havana and Matanzas provinces. It was conducted in two distinct phases: a door-to-door baseline prevalence study, conducted June 2003–May 2007; and a prospective longitudinal incidence study of the same population, June 2008–July 2011 (Figure 1). The full protocol is published elsewhere.[13,14]
Study diagram
Study population and sample recruitment The universe consisted of all adults aged ≥65 years residing in selected municipalities of Havana and Matanzas provinces in January 2003. Cluster sampling was used, with units for each cluster selected by simple random sampling without replacement.
In the prevalence phase, initial sample size was 3015; 2944 participants were interviewed and examined, a response rate of 97.6%. This included 2100 interviews in Havana of persons served by seven community polyclinics: 19 de Abril (Plaza municipality), Ana Betancourt (Playa), Cristóbal Labra (La Lisa), 27 de Noviembre, Ramón González Coro and José M. Portuondo (all in Marianao), and 14 de Junio (10 de Octubre). In addition, 915 interviews were conducted at the Milanés Polyclinic in Matanzas (city in the province of same name).
The sample was selected from neighborhood family doctor-and-nurse offices (CMF, the Spanish acronym) located <500 m from the polyclinic to which they reported. Households were selected from CMF family health records. All were visited and a population census and map were prepared for each territory. All selected individuals ≥65 years old were listed.
Prevalence study Of the participants interviewed at baseline, 131 were not available to continue due to logistical difficulties (loss of the investigator at González Coro Polyclinic), leaving 2813 eligible. Of these, 2339 (83.1%) had all data needed for frailty diagnosis.
Incidence study This was conducted from June 2008 through July 2011 (mean followup time 4.1 years). The cohort for analysis of dependency incidence was formed by all older adults who needed no special care at baseline, a total of 2225. Of these, 1662 (74.7%) were alive and re-interviewed at the end of the study (Figure 1).
Instruments The protocol was based on the 10/66 questionnaire;[13] it included a structured participant interview on sociodemographic characteristics, health status, behavioral and other risk factors; a physical and neurologic exam; and interview of a reliable informant. All materials, questionnaires and evaluations used came from the 10/66 study, previously translated from English to Spanish by two bilingual translators (one a clinician knowledgeable on the study topics), back-translated to verify accuracy, and then applied to a sample of 120 Cuban subjects. The final version was discussed by the study coordinating committee. In addition, a procedures manual and training video were prepared for the physical and neurologic exams. The principal investigator provided a week of intense training in uses and application of 10/66 instruments. Trained medical specialists applied these and conducted interviews in participants’ homes, sessions lasting 2–3 hours on average.
Protocols used for interviews and assessments were the same in the longitudinal phase of the study as at baseline. Quality control procedures included repetition of 5% of interviews by a specialist from the research team.
Variables
Sociodemographic characteristics
- Age in years (confirmed by an informant and identity card), sex, marital status (never married, married or partnered, widowed, divorced; later dichotomized into single and married/partnered), living situation (alone or with someone), education (illiterate, some primary school, primary school completed, high school completed, university completed).
- Socioeconomic status: highest occupational status achieved (self and spouse), current occupation, income and sources of income, household conditions and amenities (TV, refrigerator, potable water, indoor plumbing, electricity, telephone, car; analyzed by number of amenities). Highest occupational status achieved was assessed by asking, What is the best (highest occupational status) job you have held? Answers were coded in four categories, covering 11 occupational groups: professional (managerial, professional, paraprofessional); clerical or middle-level technical (skilled service workers, middle-level technicians, non-university-graduate teachers); skilled work (e.g., construction workers, electricians); unskilled work (e.g., farmers, skilled workers’ assistants, other unskilled occupations).
Behavioral risk factors
- Smoking status included smoker, ex-smoker and nonsmoker. Smokers and ex-smokers were asked about type of tobacco used (cigarette, cigar, pipe, chewing tobacco, snuff), average number of units per day, age at smoking initiation and, if applicable, age at cessation.
- Alcohol use questions covered maximum number of units per week before and after age 65 years. The threshold for alcoholic dependence was set at 14 units per week for women and 21 for men. Two units each were assigned to a glass of beer (250 mL), shot of rum (22 mL) or glass of wine (175 mL), and 32 units to a bottle (1000 mL) of spirits (such as rum or whisky). In addition, participants were asked, Do you remember any period in your life in which alcohol consumption was a problem for you? Did you ever get treatment or help for problems with alcoholism? The final judgment of the interviewer was based on responses from the participant and reliable informant about the possibility of alcohol problems, both before and after age 65 years.
Health conditions
- Self report of NCDs based on a structured questionnaire that included questions such as: Have you ever been told by a doctor that you had cerebral vascular disease/heart attack/angina/diabetes?[13] as well as a description of the episodes.
- Medical documentation of current medications and the following diagnoses: stroke, diabetes, hypertension, heart disease, hypercholesterolemia, tuberculosis, malaria or cysticercosis.
Diabetes mellitus diagnosis was made in two ways: self report that diabetes had been diagnosed by a physician (Were you ever told by a physician that you had diabetes? When? Did you start treatment? Are you still under treatment?) and/or fasting blood glucose ≥7 mmol/L, confirmed on two different days.[15]
- Hypertension diagnosis was made in two ways: self report (Were you ever told by a physician that you had high blood pressure? When? Did you start treatment? Are you still under treatment?) and/or by direct measurement of blood pressure. Mean systolic and diastolic blood pressure were measured twice, seated and standing. Systolic blood pressure ≥140 mm Hg and/or diastolic pressure of ≥90 mm Hg were considered hypertension, per guidelines of the European Society of Hypertension[16] and the US Joint National Committee on Prevention, Detection, Evaluation and Treatment of High Blood Pressure.[17]
- Dementia was diagnosed using the 10/66 criteria and diagnostic algorithm, transculturally validated in 26 countries, including Cuba.[13,18] This includes a structured clinical interview, the Geriatric Mental State, and its computerized algorithm (AGECAT);[19] a battery of cognitive tests from the Community Screening Interview for Dementia (CSI-D) COGSCORE;[20] the verbal fluency and 10-word delayed recall task from the Consortium to Establish a Registry for Alzheimer’s Disease (CERAD);[21] a reliable-informant interview; the CSI-D RELSCORE to verify cognitive and functional decline;[20] and additional information about dementia onset and evolution, as provided by 10/66 for diagnosis of dementia and its subtypes, history and etiology,[22] permitting dementia assessment per DSM-IV criteria.[23]
- Stroke diagnosis was based on WHO’s definition[24] and achieved through application of NEUROEX, a structured exam involving objective, quantitative measurement of focal signs, parkinsonism, ataxia, apraxia, and primitive reflexes.[25,26] The exam focuses on stroke symptoms and signs using the NIH scale.[27]
- Depression was classified as mild, moderate or severe per ICD-10, using the computerized algorithm applied to the Geriatric Mental State structured clinical interview.[19]
Frailty Four of Fried’s five criteria were used to define frailty: exhaustion, weight loss, slowed walking speed, and low physical activity, omitting the fifth (decrease of 20% in grip strength measured with a dynamometer).[9] Instead, cognitive deterioration was added. Frailty was defined by meeting ≥3 of the following criteria:
- Exhaustion: using question 48.1 of the Geriatric Mental State interview, participants reporting weakness or general tiredness.[19]
- Weight loss: Using question 53.1 of the Geriatric Mental State interview, participants reporting weight loss of ≥10 lb (4.5 kg) in the previous three months.[19]
- Slow walking speed: The time required for walking a distance of 5 meters and returning to starting point was measured; participants needing ≥16 seconds to complete this task were considered slow paced.
- Low physical activity: Self-reported inactivity when participants were asked: Considering the time that you spend working and exercising, as well as your free time; do you consider yourself physically very active, relatively active or inactive?
- Cognitive deterioration was assessed with the cognitive section of CSI-D (see dementia above).[20] The frailty cutoff was set at 29.5 points to include older adults with minimal cognitive deterioration and dementia.[13]
Dependency This was assessed with a semistructured interview of a reliable informant[28] and use of the following instruments to estimate time spent helping the older adult perform activities of daily living: Gilleard’s scale of caregiver time[29] and Davis’ caregiver activity questionnaire.[30] Older adults were classified in three groups: those needing full-time care, those needing part-time care and those who manage without assistance. Two groups were created with this variable—dependent and independent.[28]
Laboratory exams Blood samples from 2520 participants were tested for hemoglobin, haematocrit, mean cell hemoglobin, fasting blood glucose and lipid profile at the National Medical Genetics Center, Havana. In addition, cell DNA was extracted and APOE ε4 genotype determined by PCR, following the standard protocol for determination of the alipoprotein E genotype and identification of the three alleles APOE ε2, APOE ε3 and APOE ε4.[31]
Data processing and analysis Personal data and questionnaire responses were directly entered on laptops using Epidata v. 2.0; data were subsequently exported to SPSS and finally to Stata v. 9.2 (StataCorp, USA) for processing.
For the incidence study, baseline data from the prevalence study were compared to those from older adults who were re-interviewed, died or were lost to followup (chi square and Student t test were used to analyze categorical and continuous variables, respectively). Poisson regression was used to describe frailty prevalence and associated risks (crude and adjusted prevalence rates). Person-years at risk for dependency were calculated using the interval between baseline study and followup assessment and the interval midpoint was used for persons who developed dependency. The Poisson distribution was also used to estimate prevalence and incidence rate ratios (IRR) of associations with dependency and to estimate crude mortality per 1000 person-years. Cox proportional hazards model was used to estimate the hazard ratio (HR) and effect on mortality of age, sex, education, occupational status and number of household amenities, as well as dependency, frailty, and various NCDs. Missing values for each variable were recorded; 95% confidence intervals were calculated for proportions, rates and ratios.
Ethics Written informed consent was obtained from participants or, if necessary, from their caregivers. All data were kept confidential. The study protocol was approved by the Medical University of Havana’s ethics committee.
RESULTS
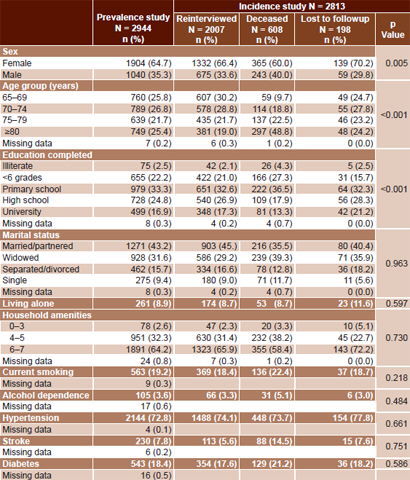
Sociodemographic characteristics, health status and behavioral risk factors Table 1 summarizes the main characteristics of older-adult participants in the prevalence and incidence studies, the latter stratified by status at followup.
Mean population age at baseline was 74 years; 25.4% were ≥80 years old, 64.7% were women, and 75.1% had completed primary school or higher educational levels. A total of 8.9% lived alone. At the time of the study, 19.2% were smokers and 3.6% were classified as alcohol dependent. Hypertension prevalence was 72.8%; 7.8% had been diagnosed with stroke and 18.4% with diabetes. Among those interviewed, including those without cardiovascular disease, 80% had at least one cardiovascular risk factor (smoking, hypertension, diabetes, obesity).
A total of 2813 older adults were included in the followup incidence study, of whom 1662 (71.3%) were re-interviewed at study end; 608 (21.6%) were deceased and 198 (7%) refused to participate or were lost to followup. No significant differences were found in variable prevalences between older adults in the baseline study and those interviewed for followup. Some differences were found, however, between the baseline sample and deceased individuals, who were older and had less education. Women predominated throughout (Table 1).
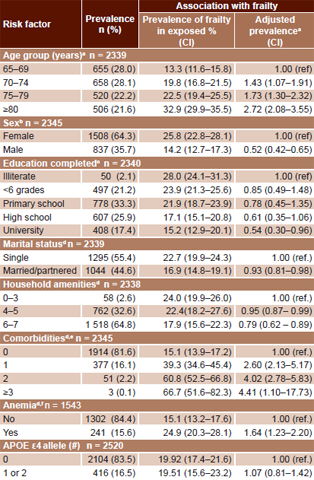
Frailty prevalence Table 2 summarizes frailty prevalence and adjusted prevalence ratios for selected variables. Baseline prevalence was 21.6% (CI 17.9%–23.8%), increasing with age, from 13.3% in group aged 65–69 years (CI 11.6–15.8) to 32.9% in the group aged ≥80 years (CI 29.9 –35.5). Frailty was more frequent in women (25.8%) than in men (14.2%), with a female:male prevalence ratio of 1.82; the ratio was ≥2 in the younger age groups but approached unity in the group aged ≥80 years (Table 2).
Prevalence of frailty was lower in older adults with higher education, with a ratio of 0.54 (CI 0.30–0.96) for university graduates. To be married or partnered was also associated with lower frailty prevalence, with a ratio of 0.93 (CI 0.81–0.98). An inverse relationship was observed between frailty and number of household amenities, with a prevalence ratio of 0.79 (CI 0.62–0.89) for 6–7 amenities.
Table 1: Demographic, socioeconomic and risk factor characteristics in study sample
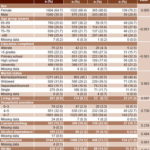
Percentages may not sum to exactly 100 due to rounding.
Presence of more comorbidities was associated with increased frailty prevalence, the risk 4.41 times greater in older adults with ≥3 comorbidities. Anemia emerged as a risk factor, with a prevalence ratio of 1.64 (CI 1.23–2.20) versus those with normal hemoglobin. No association was found between APOE ε4 genotype and frailty; the prevalence ratio for APOE ε4-homozygous individuals was 1.07 (CI 0.81–1.42).
Dependency incidence, mortality and predictive factors for mortality Of the 1662 older adults re-interviewed at the end of the study, 233 (14%) had developed dependency. Incidence of dependency was of 33.1 per 1000 person-years (CI 29.1–37.6). The mortality rate was 55.1 per 1000 person-years (CI 51.8–60.7), higher in men than in women; it doubled every 5 years, from 19.7 per 1000 person-years in the group aged 65–69 years to 120.2 per 1000 person-years in those aged ≥80 years (data not shown).
Table 2: Frailty prevalence and risk factors (n = 2813)
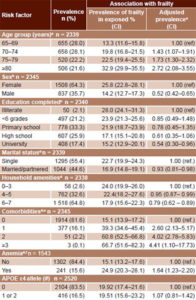
aAdjusted for sex and education
bAdjusted for age and education
cAdjusted for age and sex
dAdjusted for age, sex and education
eComorbidity (stroke/dementia/ depression/limiting physical conditions conditions)
fAnemia (women: hemoglobin <12 g/100 mL, men: hemoglobin <13 g/100 mL)
Table 3 summarizes mortality predictors corrected for age, sex and education, using Cox regression analysis. Advanced age, male sex and lower occupational status were all associated with greater mortality risk. Higher education attained and greater numbers of amenities at home were associated with lower risk of death.
The hazard ratio for increasing age by 5-year age group was 1.61 (CI 1.53–1.70); meaning that the risk of death increases 1.6 times every 5 years. After adjusting for age, sex and education, dependency (HR 3.14; CI 2.72–3.55) and frailty (HR 4.22; CI 3.43–8.27) were additional risk factors for mortality. Dementia also predicted mortality (HR 3.2; CI 2.61–3.92), as did depression (HR 1.84; CI 1.55–2.31), cerebrovascular diseases (HR 1.86; CI 1.64–2.12) and diabetes (HR 1.47; CI 1.32–1.67).
Table 3: Mortality predictors in Cuban adults aged ≥65 years, adjusted for age, sex and education by Cox regression (n = 2813)
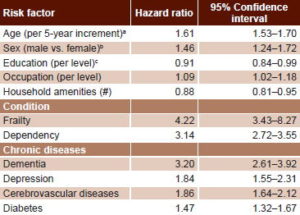
aAdjusted for sex and education
bAdjusted for age and education
cAdjusted for age and sex
DISCUSSION
This is one of the first and most extensive studies conducted in Cuba on frailty prevalence and its effect on dependency incidence and mortality in older adults, as well as its associated risk factors.
The frailty prevalence we observed was high, but lying between the highest rates reported for Cuba (42%–51%), generally local findings with small sample sizes, based on self report;[32–34] and those found by Fried in Caucasian and African-American study populations in the USA (7% and 12%, respectively).[9]
Strawbridge in the US reported frailty prevalence closer to ours, questioning 574 older adults about 16 variables in four functional domains: physical, nutritional, cognitive and sensory (visual and auditory). Participants were classified as frail if they reported problems in ≥2 domains; 26.1% were found frail.[10]
A five-city study of frail men and women’s social conditions and health from PAHO’s Study of Health, Wellbeing and Aging, using Fried’s criteria, reported frailty prevalence of 39% in adults aged ≥60 years in Havana, and corresponding prevalence in Bridgetown, Barbados of 26.7%; Mexico City, 39.5%; Sao Paulo, Brazil, 40.6%; and Santiago, Chile 42.6%.[35]
In this study, we evaluated the frailty indicators most frequently used, allowing for comparison with other research in developed and developing countries. It could be considered a limitation that we did not use Fried’s grip-strength criterion,[36] but in other longitudinal studies, association between grip strength and adverse health effects was attenuated when adjusted for other frailty indicators and potential confounders.[37–39] In a longitudinal community-based study of 751 adults aged ≥70 years, slow walking speed, low physical activity, weight loss, and cognitive decline were strongly associated with a diagnosis of frailty, but self-reported exhaustion and muscular weakness measured with a dynamometer did not perform as well as indicators. The authors therefore stressed the limited value of the latter criteria.[38]
We detected an association between frailty and aging, female sex, lower educational level, lack of spouse/partner, as well as with the presence of anemia and comorbidities. Similar results regarding sex, age, and educational level were communicated in the SABE study.[35]
In the 12-country Survey of Health and Retirement in Europe (SHARE), at the study’s conclusion individuals fulfilling Fried’s frailty criteria had 5 times greater risk of death than did nonfrail older adults.[40] Two studies in China also showed a prospective association between frailty indices and mortality.[41,42]
Frailty and dependency were the main factors predicting mortality in our cohort. A high proportion of older adults identified as frail and dependent in the baseline study also suffered from dementia, the NCD with the strongest association with mortality: risk of dying was three times greater in these individuals. Cancer, the first cause of death in Cuba,[12] was not included in this study, which constitutes a limitation, although other main causes of death were included.
Alzheimer disease is the sixth cause of death in the USA; one of every three persons aged ≥65 years dies from this disease or from another dementia. Even though a significant decrease has been registered in mortality from cardiovascular diseases and stroke, a 68% increase in Alzheimer cases was reported from 2000 to 2010.[43] The situation in Cuba is similar; the 2012 crude mortality rate for Alzheimer and dementia was 32.3 per 100,000 population,[12] but we consider Alzheimer is likely under-reported in autopsies and on death certificates.
Another limitation of this study is that the sample of older adults was restricted to two localities and thus, conclusions cannot be generalized to all of Cuba. However, the strategy of surveying simultaneously the whole population of a selected area increases response rate and facilitates longitudinal monitoring. The use of a standardized questionnaire, applied by specialized personnel, is an additional strength of the study. Also, the prospective research design reduces information bias, and there is the added benefit of providing criteria for diagnosing frailty in older adults applicable in community clinical settings.
Our findings are important for guiding improvements in control and treatment of NCDs, including dementia, and for informing provision of intensive, individualized, followup for dependent and frail older adults, which may reduce mortality in this age group. These results also suggest that education has a protective effect for mortality, which suggests a future advantage to Cubans who have benefitted from access to free education. Nevertheless, there are other environmental and socioeconomic variables that require assessment as potential predictors of mortality in older adults.
Our findings are important to orient more effective strategies for NCD prevention, control and treatment, including dementias and management of frail and dependent older adults at the primary care level—leading to decreased mortality. They also suggest higher educational level as a protective factor that could positively influence future Cuban generations. However, other contextual factors and social determinants over the life course should be taken into account in studies of advanced-age mortality.
CONCLUSIONS
Given the challenge for developing countries presented by demographic and epidemiologic transition; the high prevalence in older adults of frailty syndrome, dependency and chronic non-communicable diseases; and the association of all these with higher mortality, attention should be targeted to older adults as a risk group. This should include greater social protection, age-appropriate health services, and modification and control of cardiovascular risk factors.
References

- United Nations, Department of Economic and Social Affairs [Internet]. New York: United Nations; c2013. World Population Prospects: the 2012 Revision; 2013 [cited 2013Jun 20]. Available from: http://esa.un.org/unpd/wpp/index.htm
- Bonita R, Magnusson R, Bovet P, Zhao D, Malta DC, Geneau R, et al. Country actions to meet UN Commitments to non–communicable diseases: a stepwise approach. Lancet. 2013 Feb 16;381(866):575–84.
- Mathers CD, Loncar D. Projections of global mortality and burden of disease from 2002 to 2030. PLoS Med. 2006 Nov;3(11):e442.
- World Health Organization. Global Burden of Disease. Health Statistics and health information systems [Internet]. Geneva: World Health Organization; c2013. Projections of mortality and burden of disease, 2002–2030; 2011 [cited 2011 May 2]; [about 2 screens]. Available from: http://www.who.int/healthinfo/global_burden_disease/projections2002/en/index.html
- Harwood RH, Sayer AA, Hirschfeld M. Current and future worldwide prevalence of dependency, its relationship to total population, and dependency ratios. Bull World Health Organ. 2004 Apr;82(4):251–8.
- Sousa RM, Ferri CP, Acosta D, Albanese E, Guerra M, Huang Y, et al. Contribution of chronic diseases to disability in elderly people in countries with low and middle incomes: a 10/66 Dementia Research Group population-based survey. Lancet. 2009 Nov 28;374(9704):1821–30.
- Sousa RM, Ferri CP, Acosta D, Guerra M, Huang Y, Ks J, et al. The contribution of chronic diseases to the prevalence of dependence among older people in Latin America, China and India: a 10/66 Dementia Research Group population-based survey. BMC Geriatr. 2010 Aug 6;10:53.
- Beaglehole R, Epping-Jordan J, Patel V, Chopra M, Ebrahim S, Kidd M, et al. Improving the prevention and management of chronic diseases in low-income and middle-income countries: a priority for primary health care. Lancet. 2008 Sep 13;372(9642):940–9.
- Fried LP, Tangen CM, Walston J, Newman AB, Hirsch C, Gottdiener J, et al. Frailty in older adults: evidence for a phenotype. J Gerontol A Biol Sci Med Sci. 2001 Mar;56(3):M146–56.
- Strawbridge WJ, Shema SJ, Balfour JL, Higby HR, Kaplan GA. Antecedents of frailty over three decades in an older cohort. J Gerontol B Psychol Sci Soc Sci. 1998 Jan;53(1):S9–16.
- Avila-Funes JA, Amieva H, Barberger-Gateau P, Le Goff M, Raoux N, Ritchie K, et al. Cognitive impairment improves the predictive validity of the phenotype of frailty for adverse health outcomes: the three-city study. J Am Geriatr Soc. 2009 Mar;57(3):453–61.
- National Statistics and Medical Records Division (CU). Anuario Estadístico 2012 [Internet]. Havana: Ministry of Public Health (CU); 2013Apr [cited 2013 Mar 25]. Available from: http://files.sld.cu/dne/files/2013/04/anuario_2012.pdf. Spanish.
- Prince M, Ferri CP, Acosta D, Albanese E, Arizaga R, Dewey M, et al. The protocols for the 10/66 Dementia Research Group population-based research programme. BMC Public Health. 2007 Jul 20;7:165.
- Llibre JJ, Ferri CP, Acosta D, Guerra M, Huang Y, Jacob KS, et al. Prevalence of dementia in Latin America, India, and China: a population-based cross-sectional survey. Lancet. 2008 Aug 9;372(9637):464–74.
- American Diabetes Association. Standards of medical care in diabetes–2010. Diabetes Care. 2010 Jan;33 Suppl 1:S11–61.
- European Society of Hypertension [Internet]. Rome: European Society of Hypertension; c2002 [cited 2009 Jan]. Available from: www.eshonline.org
- Chobanian AV, Bakris GL, Black HR, Cushman WC, Green LA, Izzo JL Jr, et al. The seventh report of the Joint National Committee on Prevention, Detection, Evaluation, and Treatment of High Blood Pressure: the JNC 7 report. JAMA. 2003 May 21;289(19):2560–72.
- Prince MJ, Llibre JJ, Noriega L, Lopez A, Acosta D, Albanese E, et al. The 10/66 Dementia Research Group’s fully operationalised DSM IV dementia computerized diagnostic algorithm, compared with the 10/66 dementia algorithm and a clinician diagnosis: a population validation study. BMC Public Health. 2008 Jun 24;8:219.
- Copeland JR, Dewey ME, Griffith-Jones HM. A computerized psychiatric diagnostic system and case nomenclature for elderly subjects: GMS and AGECAT. Psychol Med. 1986 Feb;16(1):89–99.
- Hall KS, Hendrie HH, Brittain HM, Norton JA, Rodgers DD, Prince CS, et al. The development of a dementia screening interview in two distinct languages. Int J Methods Psychiatric Res. 1993;3:1–28.
- Ganguli M, Chandra V, Gilbey JE, Ratcliff G, Sharma SD, Pandav R, et al. Cognitive test performance in a community-based non demented elderly sample in rural India: the Indo-US cross national dementia epidemiology study. Int Psychogeriatr. 1996 Winter;8(4):507–24.
- Dewey ME, Copeland JR. Diagnosis of dementia from the history and aetiology schedule. Int J Geriatr Psychiatry. 2001 Sept;16(9):912–7.
- American Psychiatric Association. Diagnostic and Statistical Manual of Mental Disorders. 4th ed. Washington DC: American Psychiatric Association; 2000 Jun.
- Hatano S. Experience from a multicentre stroke register: a preliminary report. Bull World Health Organ. 1976;54(5):541–53.
- Broe GA, Akhtar AJ, Andrews GR, Caird FI, Gilmore AJ, McLennan WJ. Neurological disorders in the elderly at home. J Neurol Neurosurg Psychiatry. 1976 Apr;39(4):362–6.
- Broe GA, Jorm AF, Creasey H, Grayson D, Edelbrock D, Waite LM, et al. Impact of chronic systemic and neurological disorders on disability, depression and life satisfaction. Int J Geriatric Psych. 1998 Oct;13(10):667–73.
- Montaner J, Alvarez-Sabín J. La escala de Ictus del National Institute of Health (NIHSS). Neurologia. 2006 May;21(4):192–202. Spanish.
- Acosta D, Rottbeck R, Rodriguez G, Ferri CP, Prince MJ. The epidemiology of dependency among urban-dwelling older people in the Dominican Republic; a cross-sectional survey. BMC Public Health. 2008 Aug 13;8:285.
- Gilleard CJ, Belford H, Gilleard E, Whittick JE, Gledhill K. Emotional distress amongst the supporters of the elderly mentally infirm. Br J Psychiatry. 1984 Aug;145:172–7.
- Davis KL, Marin DB, Kane R, Patrick D, Peskind ER, Raskind MA, et al. The Caregiver Activity Survey (CAS): development and validation of a new measure for caregivers of persons with Alzheimer’s disease. Int J Geriatr Psychiatry. 1997 Oct;12(10):978–88.
- Wenham PR, Price WH, Blandell G. Apolipoprotein E genotyping by one-stage PCR. Lancet. 1991 May 11;337:1158–9.
- Lluis GE, Llibre JJ. Fragilidad en el adulto mayor: Un primer acercamiento. Rev Cubana Med Gen Integr [Internet]. 2004 Aug [cited 2013 Jan 21];20(4):[about 4 screens]. Available from: http://scielo.sld.cu/scielo.php?script=sci_arttext&pid=S0864-21252004000400009&lng=es. Spanish.
- Lluis GE. Síndrome de fragilidad en adultos mayores combatientes de la Revolución Cubana de una comunidad urbana [thesis]. [Havana]: Institute of Military Medicine (CU); 2010. Spanish.
- Alonso P, Sansó F, Díaz-Canel AM, Carrasco M. Diagnóstico de fragilidad en adultos mayores de una comunidad urbana. Rev Cubana Salud Pública [Internet]. 2009 [cited 2009 Oct 1];35(2):[14 p.]. Available from: http://www.scielosp.org/pdf/rcsp/v35n2/spu16209.pdf. Spanish.
- Alvarado BE, Zunzunegui MV, Béland F, Bamvita JM. Life course social and health condition linked to frailty in Latin American men and women. J Gerontol A Biol Sci Med Sci. 2008 Dec;63(12):1399–406.
- Fried LP, Ferrucci L, Darer J, Williamson JD, Anderson G. Untangling the concepts of disability, frailty, and comorbidity: implications for improved targeting and care. J Gerontol A Biol Sci Med Sci. 2004 Mar;59(3):255–63.
- Chin A Paw MJ, Dekker JM, Feskens EJ, Schouten EG, Kromhout D. How to select a frail elderly population? A comparison of three working definitions. J Clin Epidemiol. 1999 Nov;52(11):1015–21.
- Rothman MD, Leo-Summers L, Gill TM. Prognostic significance of potential frailty criteria. J Am Geriatr Soc. 2008 Dec;56(12):2211–6.
- Syddall H, Cooper C, Martin F, Briggs R, Aihie A. Is grip strength a useful single marker of frailty? Age Ageing. 2003 Nov;32(6):650–6.
- Romero-Ortuno R, Walsh CD, Lawlor BA, Kenny RA. A Frailty Instrument for primary care: findings from the Survey of Health, Ageing and Retirement in Europe (SHARE). BMC Geriatr. 2010 Aug 24;10:57.
- Gu D, Dupre ME, Sautter J, Zhu H, Liu Y, Yi Z. Frailty and mortality among Chinese at advanced ages. J Gerontol B Psychol Sci Soc Sci. 2009 Mar;64(2):279–89.
- Yu P, Song X, Shi J, Mitnitski A, Tang Z, Fang X, et al. Frailty and survival of older Chinese adults in urban and rural areas: Results from the Beijing Longitudinal Study of Aging. Arch Gerontol Geriatr. 2012 Jan–Feb;54(1):3–8.
- Alzheimer’s Association [Internet]. Chicago: Alzheimer’s Association; c2013. Alzheimer’s Disease Facts and Figures. Alzheimer’s & Dementia; 2013 [cited 2013 Mar 25]. Available from: http://www.alz.org/downloads/facts_figures_2013.pdf
THE AUTHORS Juan de Jesús Llibre Rodríguez (Corresponding author: mguerra@infomed.sld.cu), internist with a doctorate in medical sciences. Full professor and senior researcher, Alzheimer Studies Center, Finlay-Albarrán Faculty of Medical Sciences, Medical University of Havana, Cuba. Ana M. López Medina, physician with specialties in family medicine, geriatrics and gerontology; and a master’s degree in healthy aging. Assistant professor, Héroes del Corynthia University Polyclinic, Havana, Cuba. Adolfo Valhuerdi Cepero, internist with a master’s degree in emergency medicine. Assistant professor, Faustino Pérez University Hospital, Matanzas, Cuba. Milagros Guerra Hernández, physician specializing in family medicine and psychiatry with a master’s degree in healthy aging. Instructor, 27 de Noviembre University Polyclinic, Marianao, Havana, Cuba. Jorge J. Llibre-Guerra, neurology resident. Instructor, Neurology and Neurosurgery Institute, Havana, Cuba. Y. Yvonne Sánchez Gil, psychiatrist with a master’s degree in healthy aging. Associate professor, Ana Betancourt University Polyclinic, Playa, Havana, Cuba. Rodolfo Bosch Bayard, internist. Associate professor, Alzheimer Studies Center, Finlay-Albarrán Faculty of Medical Sciences, Medical University of Havana, Cuba. Tania Zayas Llerena, information management specialist. Instructor, Alzheimer Studies Center, Finlay-Albarrán Faculty of Medical Sciences, Medical University of Havana, Cuba. Carmen Moreno Carbonell, physician specializing in epidemiology. Full and consulting professor, Alzheimer Studies Center, Finlay-Albarrán Faculty of Medical Sciences, Medical University of Havana, Cuba.
Submitted: April 6, 2013 Approved: January 2, 2014 Disclosures: None