INTRODUCTION Anemia is a public health problem worldwide and is most prevalent in preschool children, for whom it is the most frequent cause of nutritional deficits. In turn, iron deficiency is the main cause of anemia, affecting 43% of children globally. Previous studies in Cuba show rates of iron deficiency in preschool children between 38.6% and 57.6%, higher in infants (71.2% to 81.1%). WHO recommends using serum ferritin as an indicator of iron deficiency accompanied by acute (C-reactive protein) and chronic (α1-acid glycoprotein) inflammation biomarkers.
OBJECTIVE Assess how inflammation affects measuring and reporting of iron-deficiency anemia rates in Cuban preschool children.
METHODS Data were obtained from serum samples contained in the National Anemia and Iron Deficiency Survey, and included presumably healthy preschool Cuban children (aged 6–59 months). Serum samples were collected from 1375 children from randomly selected provinces in 4 regions of the country from 2014 through 2018. We examined the association between ferritin and two inflammatory biomarkers: C-reactive protein and α1-acid glycoprotein. Individual inflammation-adjusted ferritin concentrations were calculated using four approaches: 1) a higher ferritin cut-off point (<30 g/L); 2) exclusion of subjects showing inflammation (C-reactive protein >5 mg/L or α1-acid glycoprotein >1 g/L); 3) mathematical correction factor based on C-reactive protein or α1-acid glycoprotein; and 4) correction by regression with the method proposed by the Biomarkers Reflecting Inflammation and Nutritional Determinants of Anemia Group. We estimated confidence intervals of differencesbetween unadjusted prevalence and prevalence adjusted for inflammation by each method.
RESULTS The proportion of children with inflammation according to C-reactive protein concentrations >5 mg/L was lower (11.1%, 153/1375) than the proportion measured according to the concentrations of α1-acid glycoprotein, at >1 g/L (30.8%, 424/1375). The percentage of children with high concentrations of at least one of the aforementioned biomarkers was 32.7% (450/1375). Thus, each correction method increased the observed prevalence of iron deficiency compared to unadjusted estimates (23%, 316/1375). This increase was more pronounced when using the internal regression correction method (based only on C-reactive protein) or the method based on a higher cut-off point. Adjustment using all four methods changed estimated iron deficiency prevalence, increasing it from 0.1% to 8.8%, compared to unadjusted values.
CONCLUSION One-third of preschool children had biomarkers indicating elevated inflammation levels. Without adjusting for inflammation, iron deficiency prevalence was underestimated. The significant disparity between unadjusted and inflammation-adjusted ferritin when using some approaches highlights the importance of selecting the right approach for accurate, corrected measurement. The internal regression correction approach is appropriate for epidemiological studies because it takes into account inflammation severity. However, other models should be explored that account for inflammation and also provide better adjusted ferritin concentrations.
KEYWORDS Anemia, iron deficiency; child, preschool; inflammation; Cuba
ABSTRACT INTRODUCTION Anemia is a public health problem worldwide and is most prevalent in preschool children, for whom it is the most frequent cause of nutritional deficits. In turn, iron deficiency is the main cause of anemia, affecting 43% of children globally. Previous studies in Cuba show rates of iron deficiency in preschool children between 38.6% and 57.6%, higher in infants (71.2% to 81.1%). WHO recommends using serum ferritin as an indicator of iron deficiency accompanied by acute (C-reactive protein) and chronic (α1-acid glycoprotein) inflammation biomarkers.
OBJECTIVE Assess how inflammation affects measuring and reporting of iron-deficiency anemia rates in Cuban preschool children.
METHODS Data were obtained from serum samples contained in the National Anemia and Iron Deficiency Survey, and included presumably healthy preschool Cuban children (aged 6–59 months). Serum samples were collected from 1375 children from randomly selected provinces in 4 regions of the country from 2014 through 2018. We examined the association between ferritin and two inflammatory biomarkers: C-reactive protein and α1-acid glycoprotein. Individual inflammation-adjusted ferritin concentrations were calculated using four approaches: 1) a higher ferritin cut-off point (<30 g/L); 2) exclusion of subjects showing inflammation (C-reactive protein >5 mg/L or α1-acid glycoprotein >1 g/L); 3) mathematical correction factor based on C-reactive protein or α1-acid glycoprotein; and 4) correction by regression with the method proposed by the Biomarkers Reflecting Inflammation and Nutritional Determinants of Anemia Group. We estimated confidence intervals of differences between unadjusted prevalence and prevalence adjusted for inflammation by each method.
RESULTS The proportion of children with inflammation according to C-reactive protein concentrations >5 mg/L was lower (11.1%, 153/1375) than the proportion measured according to the concentrations of α1-acid glycoprotein, at >1 g/L (30.8%, 424/1375). The percentage of children with high concentrations of at least one of the aforementioned biomarkers was 32.7% (450/1375). Thus, each correction method increased the observed prevalence of iron deficiency compared to unadjusted estimates (23%, 316/1375). This increase was more pronounced when using the internal regression correction method (based only on C-reactive protein) or the method based on a higher cut-off point. Adjustment using all four methods changed estimated iron deficiency prevalence, increasing it from 0.1% to 8.8%, compared to unadjusted values.
CONCLUSION One-third of preschool children had biomarkers indicating elevated inflammation levels. Without adjusting for inflammation, iron deficiency prevalence was underestimated. The significant disparity between unadjusted and inflammation-adjusted ferritin when using some approaches highlights the importance of selecting the right approach for accurate, corrected measurement. The internal regression correction approach is appropriate for epidemiological studies because it takes into account inflammation severity. However, other models should be explored that account for inflammation and also provide better adjusted ferritin concentrations.
KEYWORDS Anemia, iron deficiency; child, preschool; inflammation; Cuba
INTRODUCTION Anemia is a public health problem affecting millions of persons globally. It is most frequent in preschool children,[1] with an estimated 273 million affected worldwide. Among them, 43% have iron-deficiency anemia.[2] Previous studies in Cuba show iron deficiency rates in preschool children between 38.6% and 57.6%,[3–5] while higher rates have been found in infants (71.2%–81.1%).[6] Iron deficiency occurs mainly in the first two years of life due to the low iron content and decreased bioavailability of supplementary foods that do not cover a developing child’s nutritional requirements, in addition to children’s rapid growth rate during their first year of life.[7]
IMPORTANCE This is the first national study in Cuba that confirms the usefulness of two inflammation biomarkers for adjusting ferritin concentrations in preschool children, resulting in a more accurate determination of iron-deficiency anemia.
WHO considers serum ferritin concentration as the best iron level indicator.[7] Ferritin, however, is also an acute-phase protein (APP) that increases during inflammatory processes. Because inflammation levels cannot be determined through routine clinical examination in apparently healthy persons, WHO suggests confirming inflammation by measuring ferritin in addition to other APPs.[7]
Several approaches have been proposed to correct the bias in ferritin measurement introduced by inflammation,[8–13] but a consensus has not been reached on how to use APPs to adjust for inflammation’s effect on ferritin concentration. The most common inflammation biomarkers used in clinical practice and nutritional research include C-reactive protein (CRP) and α-1 acid glycoprotein (AGP).[14] In populations with high inflammation prevalence, failure to assess acute-phase proteins could greatly impact micronutrient deficiency prevalence measurements, specifically those pertaining to iron deficiency.[14]
The Cuban population is thought to have low levels of inflammation[15] since it does not have case reports of infection due to malaria and schistosomiasis and it benefits from safe drinking water and sanitation. However, assessing inflammation when analyzing the population’s iron status is important, as there are other risk or morbidity factors in Cuba associated with inflammation such as obesity, asthma, acute diarrheal diseases (ADD), acute respiratory infections (ARI) and other infections.[14]
Cuba’s National Hygiene, Epidemiology and Microbiology Institute (INHEM) has been in charge of the design, implementation and surveillance of varying prevention and control programs for iron status since 1987. The Comprehensive Plan for Prevention and Control of Iron-deficiency Anemia was established in 2008 by the Council of Ministers.[16] It includes programs for food supplements, fortified foods and diet diversity, plus program surveillance. In spite of this, iron-deficiency anemia prevalence remains high in preschool children.
Correctly assessing iron deficiency and the factors associated with it (inflammation; nutritional status; related comorbidities; and genetic, physiologic and socio-demographic factors) would help create more effective prevention strategies better able to respond to the causes of anemia in Cuba.
The aim of this paper is to assess how inflammation may influence the measurement and reporting of iron status in Cuban preschool children.
METHODS INHEM carried out a cross-sectional study in Cuban preschool children during February through April annually from 2015 to 2018. Data from the National Survey of Anemia and Iron Deficiency in Cuban Preschool Children (as yet unpublished) were used for analysis.
Sample selection The study universe included children aged 6–59 months. The sample consisted of 1400 children. The sample size was calculated assuming an overall anemia prevalence of 20% in the country in this age group, a predicted sample size reduction of 10% due to non-response, a confidence level of 95%, a relative precision of <3% and a design effect of 2%.
Cuba has 15 provinces and one Special Municipality. The sample was stratified by region: west, central, east (northeast and southeast) and the province of Havana, the latter considered a region in itself. Each region was represented by either one or two provinces. Two provinces were selected at random in the western and central regions: Mayabeque Province and the Isle of Youth Special Municipality, considered here as a province, in the west; and Sancti Spíritus and Cienfuegos Provinces in the central region. For the northeast and southeast regions, we randomly selected only one province per region: Holguín Province for the northeast, and Santiago de Cuba province for the southeast. We randomly selected 30% of municipalities from each province, which included the municipal capital.
Primary health care in Cuba is organized under municipal health departments, under which multispecialty community polyclinics act as hubs and supervise the work of family doctor-and-nurse offices located in the surrounding geographic health areas. The entire population in each health area is served by both the local polyclinic and family doctor-and-nurse offices.[17] In consideration of this structure, we used two-stage cluster sampling, in which health areas were the primary selection units in each municipality, and family doctor-and-nurse offices were secondary units. Using this method, 200 children were studied in each of the selected provinces.
We selected the minimum number of doctors’ offices required to reach the specific sample size, considering the average number of children served by the offices in each municipality. All children aged 6–59 months in the catchment area of the selected family doctor’s office were included in the sample.
The study included presumably healthy children, free of chronic disease (sickle cell anemia, diabetes, kidney disease, epilepsy, severe or moderate asthma, or any other disease requiring treatment or specialized medical care). Based on these criteria, we enrolled 1417 children in the survey database. A total of 1375 children with complete records on serum ferritin and inflammation (CRP and AGP) were finally included.
Biochemical data Three mL of blood were taken through antecubital puncture. Samples were centrifuged the same day as extraction, and blood serum was stored at –40 °C for later analysis for ferritin and inflammation indicators. Iron deficiency was measured through ferritin concentration, and inflammation was measured through high-sensitivity CRP and AGP in the serum. Indicators for ferritin and inflammation were determined by the immuno-turbidmetric method using INLAB 240 equipment (CPM Scientifica Tecnologie Biomediche, Italy). The limit of detection (LOD) reported for CRP, AGP and ferritin was 0.1 mg/L, 0.04 g/L and 5.2 μg/L respectively. When the CRP, AGP or ferritin concentrations were lower than that of the LOD, they were set equal to their respective LOD’s and reported as such by the laboratories. These determinations were made by trained personnel at INHEM’s Nutritional Anemia Laboratory using quality control reference guides from CPM. The National Metrology Research Institute calibrated the equipment.
Defining cases Iron deficiency was defined as ferritin concentrations <12 µg/L, a cut-off point recommended by WHO.[8] Inflammation was declared when CRP concentrations were >5 mg/L, AGP concentrations were >1 g/L, or both.[18]
Statistical analysis Data management and statistical analyses used R software version 3.5.3 (Free Software Foundation, USA).[19] Simple statistics and histograms were used to study distribution of biochemical variables. All variables showed some type of positive asymmetry and were transformed logarithmically.
We used four approaches to eliminate inflammation’s influence on ferritin concentration: 1) an increase in the cut-off point;[7] 2) exclusion of subjects with inflammation from the analysis, as explained;[20] 3) an inflammation correction factor;[18] and 4) correction by linear regression via the method proposed by Biomarkers Reflecting Inflammation and Nutritional Determinants of Anemia (BRINDA).[20]
To evaluate the influence of each inflammation biomarker (CRP and AGP) on ferritin concentration, all analyses were made using both individual and combined biomarkers. We estimated iron deficiency prevalence and referenced these estimates as non-proportional estimations on sampling. We calculated 95% confidence intervals (CI) of the differences between the unadjusted prevalences and those adjusted for inflammation, by each method.
To identify potential relationships between inflammation and age, the study also obtained separate results for two age groups: children aged 6–23 months (<2 years) and children aged 24–59 months (≥2 years).
Inflammation Correction Approaches Increasing the cut-off point This approach classifies those individuals with inflammation (concentrations of CRP >5 mg/L or AGP >1 g/L), as having iron deficiency when serum ferritin concentrations are <30 g/L.
Subject exclusion This discards individuals with high levels of inflammation biomarker concentrations (concentrations of CRP >5 mg/L or AGP 1 g/L) and calculates the prevalence of iron deficiency for individuals without inflammation.
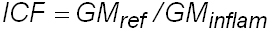
Correction factor The internal correction factor (ICF) approach, proposed by Thurnham,[18] uses mathematical correction factors. Individuals are classified into four groups by states of inflammation: 1) reference (CRP ≤5 mg/L and AGP ≤1 g/L); 2) incubation (CRP >5 mg/L and AGP ≤1 g/L); 3) early convalescence (CRP >5 mg/L and AGP >1 g/L); and 4) late convalescence (CRP ≤5 mg/L and AGP >1 g/L).
Additionally, we calculated ICF for two groups (those with inflammation and those without inflammation) for each biomarker (CRP and AGP), separately.
Internal Correction Factors Based on internal survey-specific data, internal correction factors were then generated by dividing the geometric mean (GM) of ferritin values of the non-inflammation group by GM ferritin values of each inflammation group:
Where ref and inflam are the reference and the inflammation groups, respectively.
Correction factors are defined as the ratio between the ferritin GM of the reference group and the ferritin GM for each inflammation group.
Ferritin values for those in the groups with high inflammation biomarker concentrations are multiplied by the ICF corresponding to their inflammation group to obtain adjusted ferritin values. To compare ferritin concentrations between the subgroup without inflammation and each subgroup with inflammation, we used the Student t-test to compare geometric means, and we obtained 95% CI for the ratio of geometric means.
Correction by regression This approach (internal regression correction, IRC) is based on linear regression models used to adjust for ferritin concentrations in the presence of inflammation.
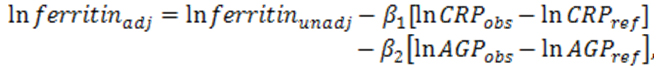
Following methodology proposed by BRINDA,[20] we used regression coefficients of models where the response variable is the logarithm of the ferritin concentrations, and where the transformed variables ln(CRP) and ln(AGP) are included as continuous predictors.
Multivariate regression that considers both biomarkers (AGP and CRP) was used to show different stages of inflammation. To adjust for individual concentrations of ferritin, in the multivariate case, the influence of CRP and AGP is subtracted:
Where the subindexes adj and unadj refer to adjusted and unadjusted values of ferritin concentration, and β1 and β2 are regression coefficients for CRP and AGP, respectively. The subindex obs refers to the values observed for the independent variables and the subindex ref refers to the inflammation reference values assuming that these mark the cut-off points for the CRP and AGP biomarkers, which show the increase in ferritin concentrations.
The reference value is defined as the maximum value of the lowest decile of the specific marker (AGP or CRP). The reference values we obtained were CRP = 0.10 mg/L and AGP = 0.54 g/L. Adjustments were applied only in the case of CRP >lnCRPref, AGP >lnAGPref, or both.
A multi-colinearity test was performed between ln(CRP) and ln(AGP), on the basis of a tolerance test (>0.1) and a variance inflation factor (<5) to determine whether it was appropriate to include both variables in the model. To avoid over-adjustment, the correction was applied only to the ferritin concentrations that corresponded to individuals with values of CRP or AGP that were greater than the reference values.
The analysis also eliminated individuals with censored data (CRP <LOD), taking into account that adjustment of the regression models with censored variables may produce bias when estimating the model’s coefficients.[21]
Ethics The study was authorized by the Maternal–Child Division of the Ministry of Public Health, after reviewing the research’s ethical aspects. All mothers gave informed consent to include their children in the study. Our work was conducted according to principles for conducting research in human subjects outlined by the Helsinki Declaration,[22] and the protocol was approved by the research ethics committee assigned to this project.
RESULTS Participant characteristics The sample distribution was as follows, by age and sex: 36.4% (500/1375) aged <2 years; 63.6% (875/1375) aged ≥2 years; 51.1% (703/1375) male; 48.9% (672/1375) female.
The median CRP value was 0.91 mg/L (quartile 1 = 0.52; quartile 3 = 1.83), far below the cut-off point. The median AGP value was 0.86 g/L (quartile 1 = 0.69; quartile 3 = 1.07), indicating that more than 25% of children had values above the cut-off point.
Inflammation prevalence assessed by CRP concentrations >5 mg/L was less (at 11.1%, 153/1375) than that assessed by AGP concentrations >1 g/L (30.8%, 424/1375). The proportion of children with high concentrations of at least one biomarker was 32.7% (450/1375).The highest inflammation prevalence was found in those aged <2 years (n = 500) for all 3 inflammation conditions (CRP 11.8%, 59/500; AGP 33.4%, 167/500; or both 34.6%, 173/500), with no significant differences between age groups (CRP p = 0.610, AGP p = 0.156, both p = 0.325).
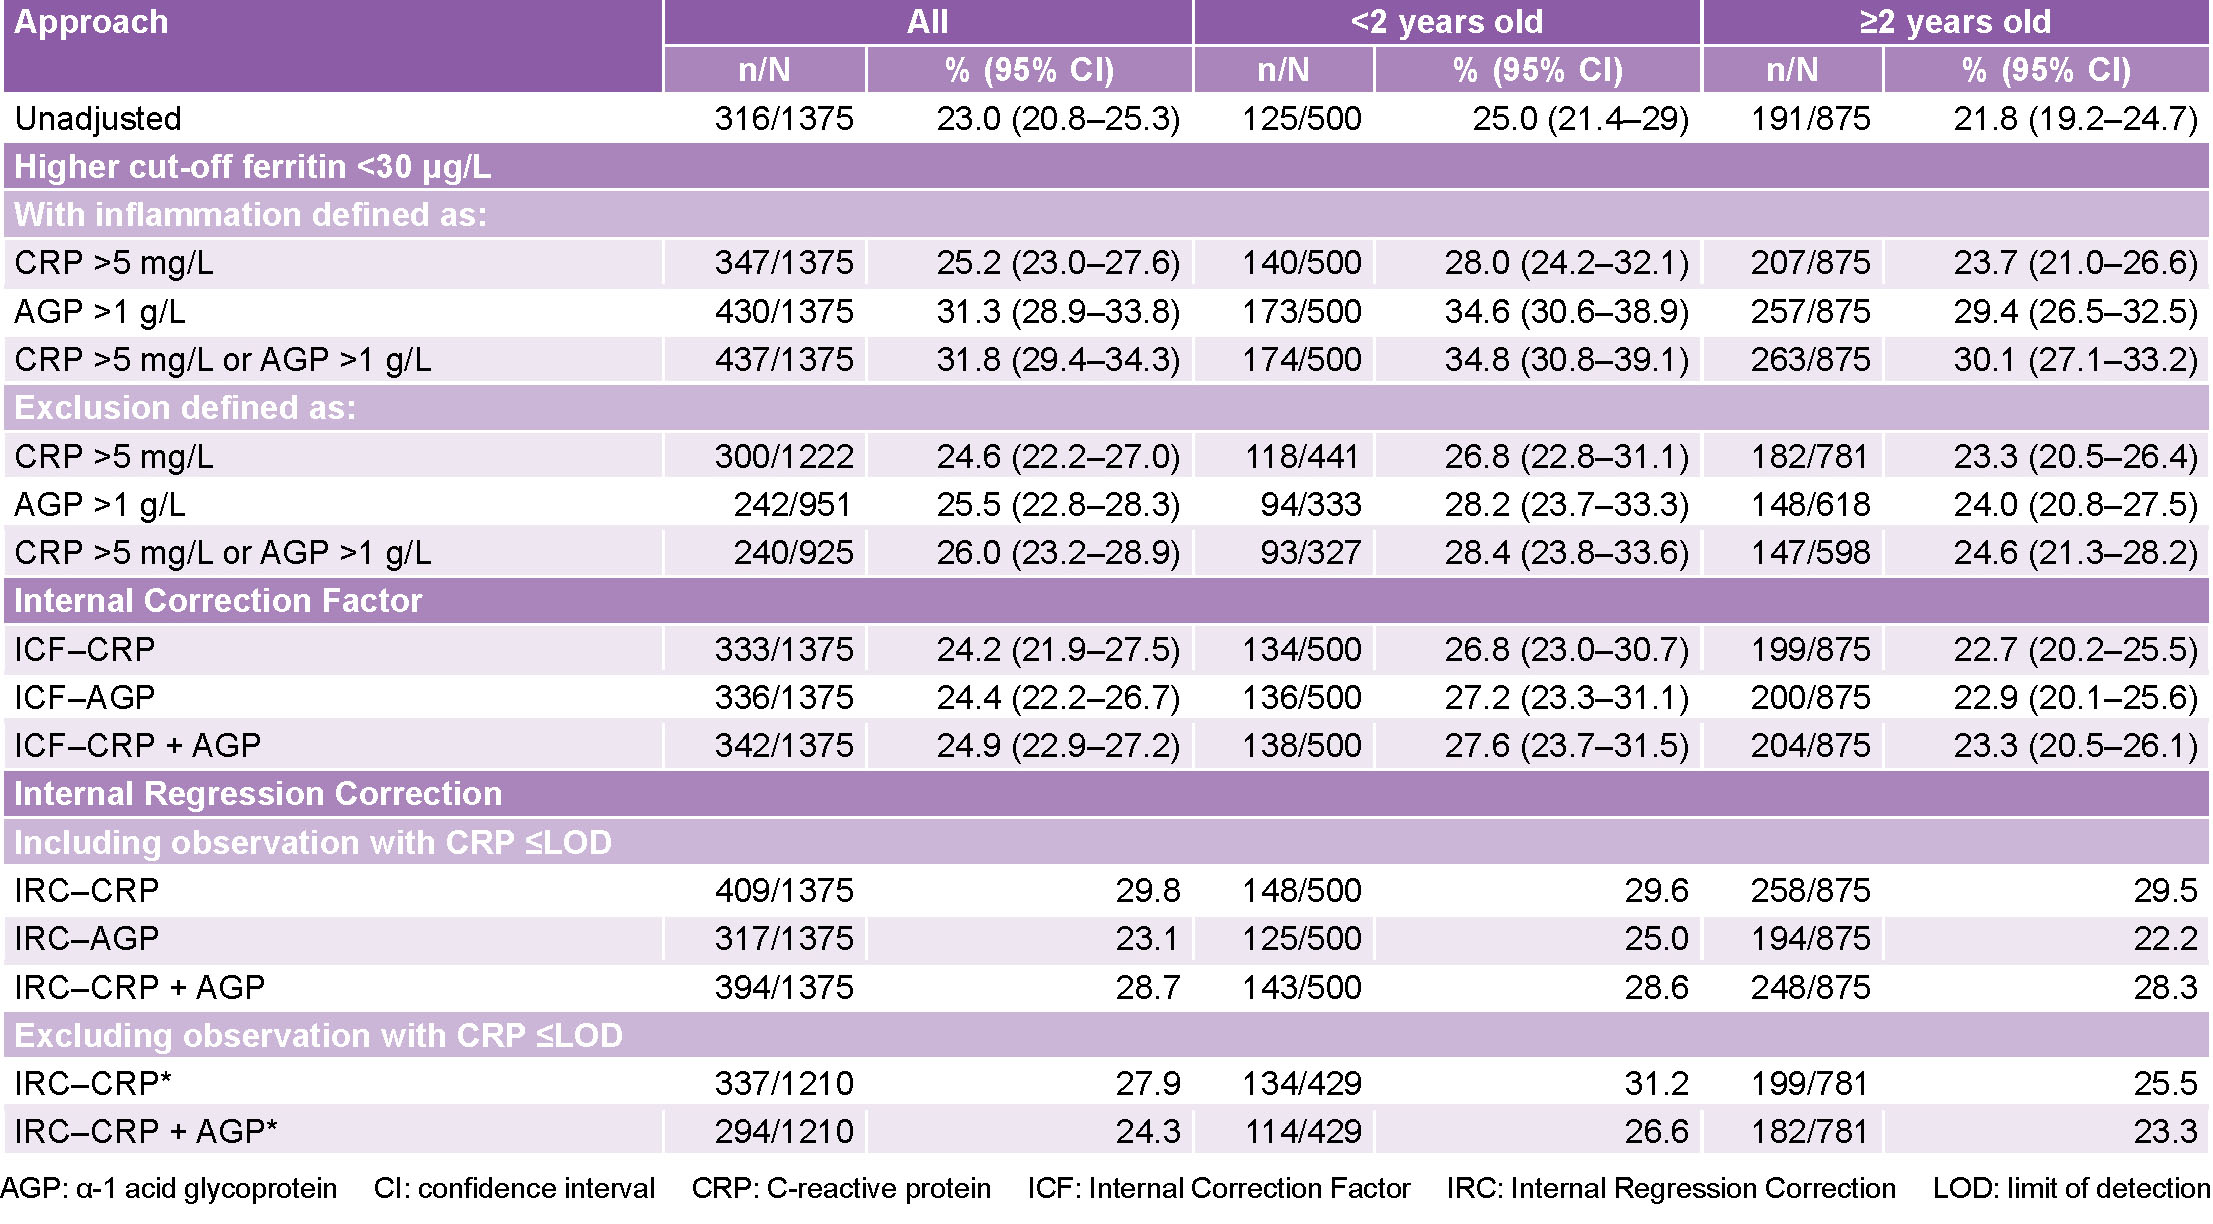
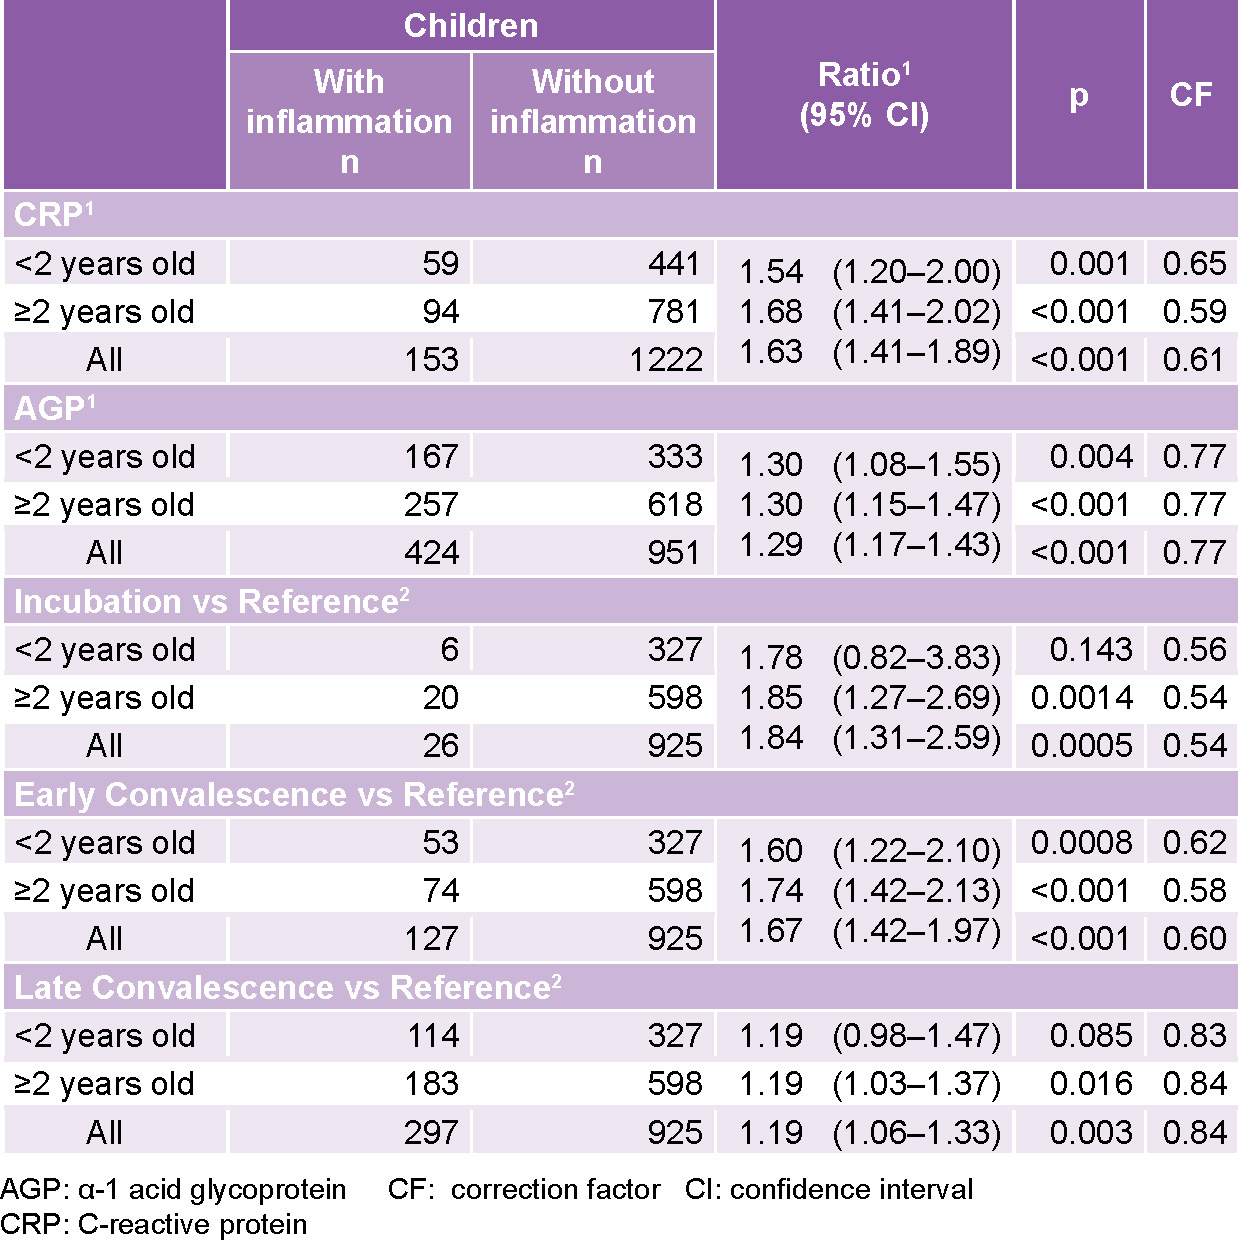
Inflammation correction approaches Increasing the cut-off point Iron deficiency prevalence increased in the entire sample from 23% (316/1375) to 31.8% (437/1375). For children aged <2 years, it increased by 9.8 percentage points and in those aged ≥2 years, it increased by 8.3 percentage points (Table 1).
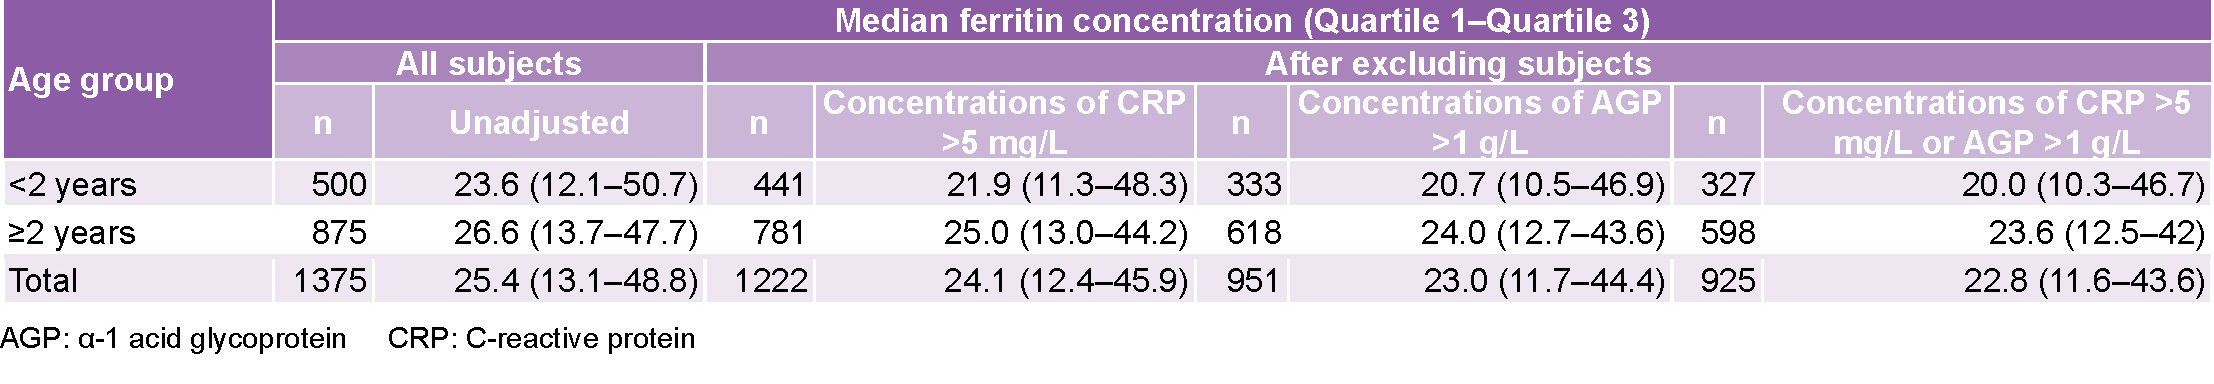
Subject exclusion Eliminating cases where inflammation was present resulted in a 32.7% (450/1375) reduction in cases. Ferritin values before and after these exclusions yielded a slight reduction in median concentrations, both in the whole sample and in the two age groups, with no significant differences between the two age groups. The decrease in concentration was about 3 μg/L (Table 2).
Table 1: Prevalence of iron deficiency and confidence interval by age group, without adjustment and after adjusting for ferritin concentrations in the presence of inflammation
n: number of individuals with inflammation; N: number of total individuals in the group. The increase in the cut-off point approach (higher cut-off; AGP + CRP) considers individuals with high concentrations of inflammation biomarkers (CRP >5 mg/L and AGP >1 g/L) to be iron deficienct if ferritin concentrations are <30 μg/L. The exclusion approach (exclusion, AGP + CRP) discards individuals with high inflammation biomarker concentrations (CRP >5mg/L and AGP >1 g/L) and calculates the prevalence of iron deficiency for individuals without inflammation. The correction factor approach (ICF-AGP + CRP) uses correction factors. Correction factors are defined as the ratio between the geometric mean of the ferritin values of the reference group (CRP and AGP are not increased) and ferritin’s geometric mean for each inflammation group. The correction by regression approach (IRC-AGP + CRP) uses linear regression to adjust serum ferritin concentrations using CRP and AGP concentrations as continuous predictors.
*The exclusion approach excludes individuals with censored CRP values (CRP <0.1 mg/L than the LOD). Regression coefficients depend on the sample so they are different for each study group and for the sample in its entirety, therefore the sum of number of individuals with iron deficiency after adjusting for inflammation using ICR on each study group does not necessarily equal the number of individuals with iron deficiency after adjusting for inflammation using ICR on the entire sample. Values indicate prevalence, % (95% CI, where applicable); 95% CIs are not reported for the internal correction regression method because they do not take into account variability in the estimates for the regression coefficients of the slopes used to derive adjusted ferritin values.
Iron deficiency prevalence values ranged from 23% (316/1375) before excluding cases, to 26% (240/925) for the entire sample. Iron deficiency increased from 25% (125/500) to 28.4% (93/327) for the group aged <2 years and from 21.8% (191/875) to 24.6% (147/598) for those aged ≥2 years, after excluding subjects with inflammation (Table 1).
Internal CorrectionFactor Ferritin concentration in the reference group was compared to each of the three inflammation groups in each age category. The geometric mean of ferritin was lower in children without inflammation compared to those with inflammation in all groups (Table 3).
Considering the entire sample, the ratio of the ferritin concentration geometric means for each inflammation group and the reference group produced values >1 for the five comparison scenarios. In other words, the quotient of ferritin’s geometric mean was higher in the corresponding inflammation group than in the reference group (Table 3). Specifically, the geometric mean of ferritin was 84% (39.76/21.57) higher in the incubation group than in the reference group, 67% (36.09/21.57) higher in the early convalescence group than in the reference group, and only 19% (25.68/21.57) higher in the late convalescence group. The ratio of geometric means was significantly higher than 1 (p <0.05) in all variants, except for the group aged <2 years in incubation and late convalescence groups.
Table 2: Median ferritin concentration (µg/L) before and after excluding subjects with high CRP/AGP concentrations
Table 3: Ferritin adjusted for inflammation using the correction factor approach
The ratio column indicates the ratio of the geometric means of ferritin concentrations (95% CI) in µg/L for: 1 groups with and without inflammation as indicated by CRP or AGP concentration 2 inflammation group versus reference group comparisons; reference: CRP concentration ≤5 mg/L and AGP concentration ≤1 g/L; incubation: CRP concentration >5 mg/L and AGP concentration ≤1 g/L; early convalescence: CRP concentration >5 mg/L and AGP concentration >1g/L; late convalescence: AGP concentration >1 g/L and CRP concentration ≤5 mg/L; p: p values associated to a test for comparing geometric means
Estimated iron deficiency prevalence for the entire sample with ICF increased from 23% (316/1375) to 24.4% (336/1375), adjusted only for AGP, while estimated prevalence for AGP and CRP increased from 23% (316/1375) to 24.9% (342/1375) (Table 1).
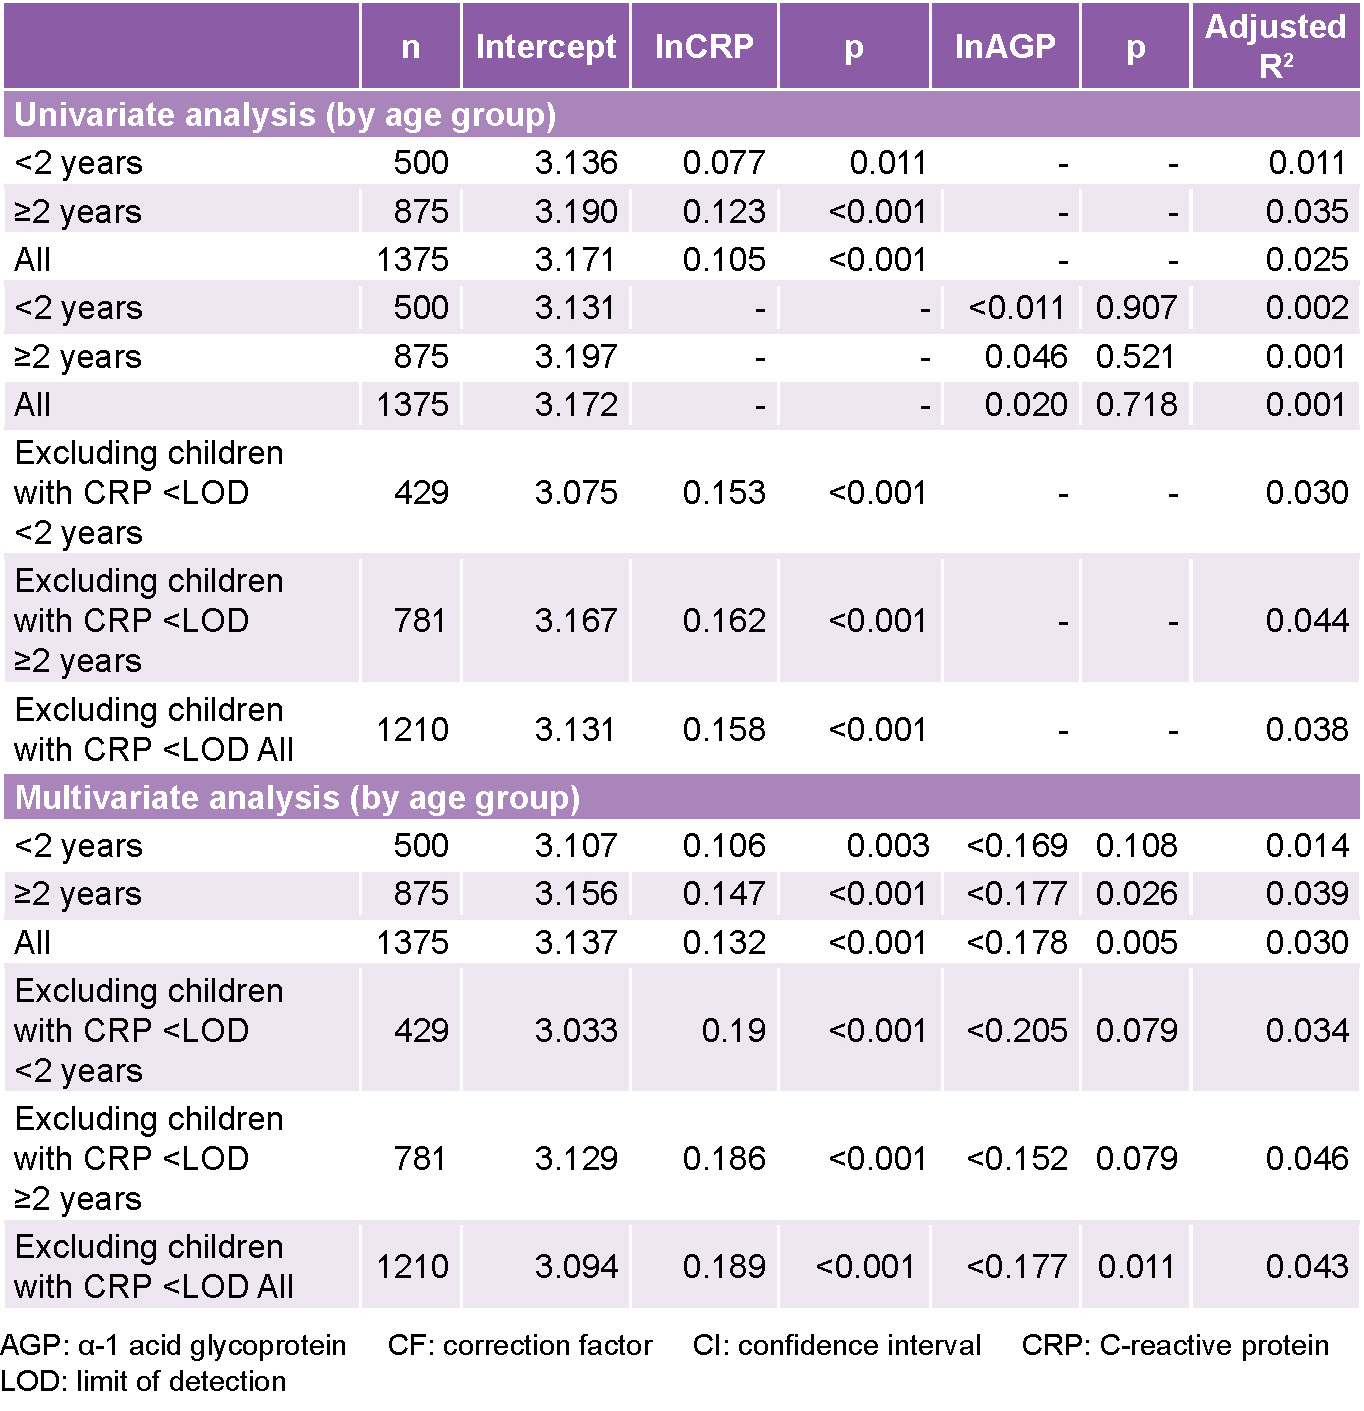
Internal RegressionCorrection Results of this analysis are shown in Table 4. For CRP, the reference value calculated (0.1 mg/L) was the same in each group. For AGP, the reference values were 0.51 g/L, 0.55 g/L and 0.54 g/L for the two age groups and the entire sample, respectively. Excluding children with censored values of CRP (CRP <LOD) produced an increase in the value of the slope between concentrations of ln(ferritin) and ln(CRP) in both models (univariate analysis for all: 0.105 vs. 0.158; multivariate analysis for all: 0.132 vs. 0.189) indicating that exclusion of censored data may bias coefficient estimation, and increase the effect of inflammation on ferritin. The exclusion reduced sample size by 12% from 1375 to 1210.
Exploratory analysis and descriptive statistics (not considered in this paper) show that children with undetected CRP values tend, on average, to be less iron deficient.
The estimated regression coefficient in multivariate analysis for the association between ln(ferritin) and ln(CRP) concentrations was higher than the corresponding values in the univariate analysis (the entire sample, excluding children with CRP <LOD: 0.158 vs. 0.189). This indicates that this relationship is better adjusted by including ln(AGP) in the model, which, because of its negative effect, tends to balance the effect of ln(CRP).
Estimating prevalence Use of this methodology produced an increase in estimated iron deficiency prevalence in the entire sample, from 23% (316/1375) to 28.7% (394/1375) when the censored values were included and to 24.3% (294/1210) when they were excluded (Table 1). Prevalence ranges obtained from models with significant coefficients varied between 24.3% (294/1210) (IRC–CRP + AGP, excluding children with CRP <LOD), and 29.8% (409/1375) (IRC–CRP), which represents an underestimation (from 1.3% to 6.8%) of the prevalence observed without adjustment.
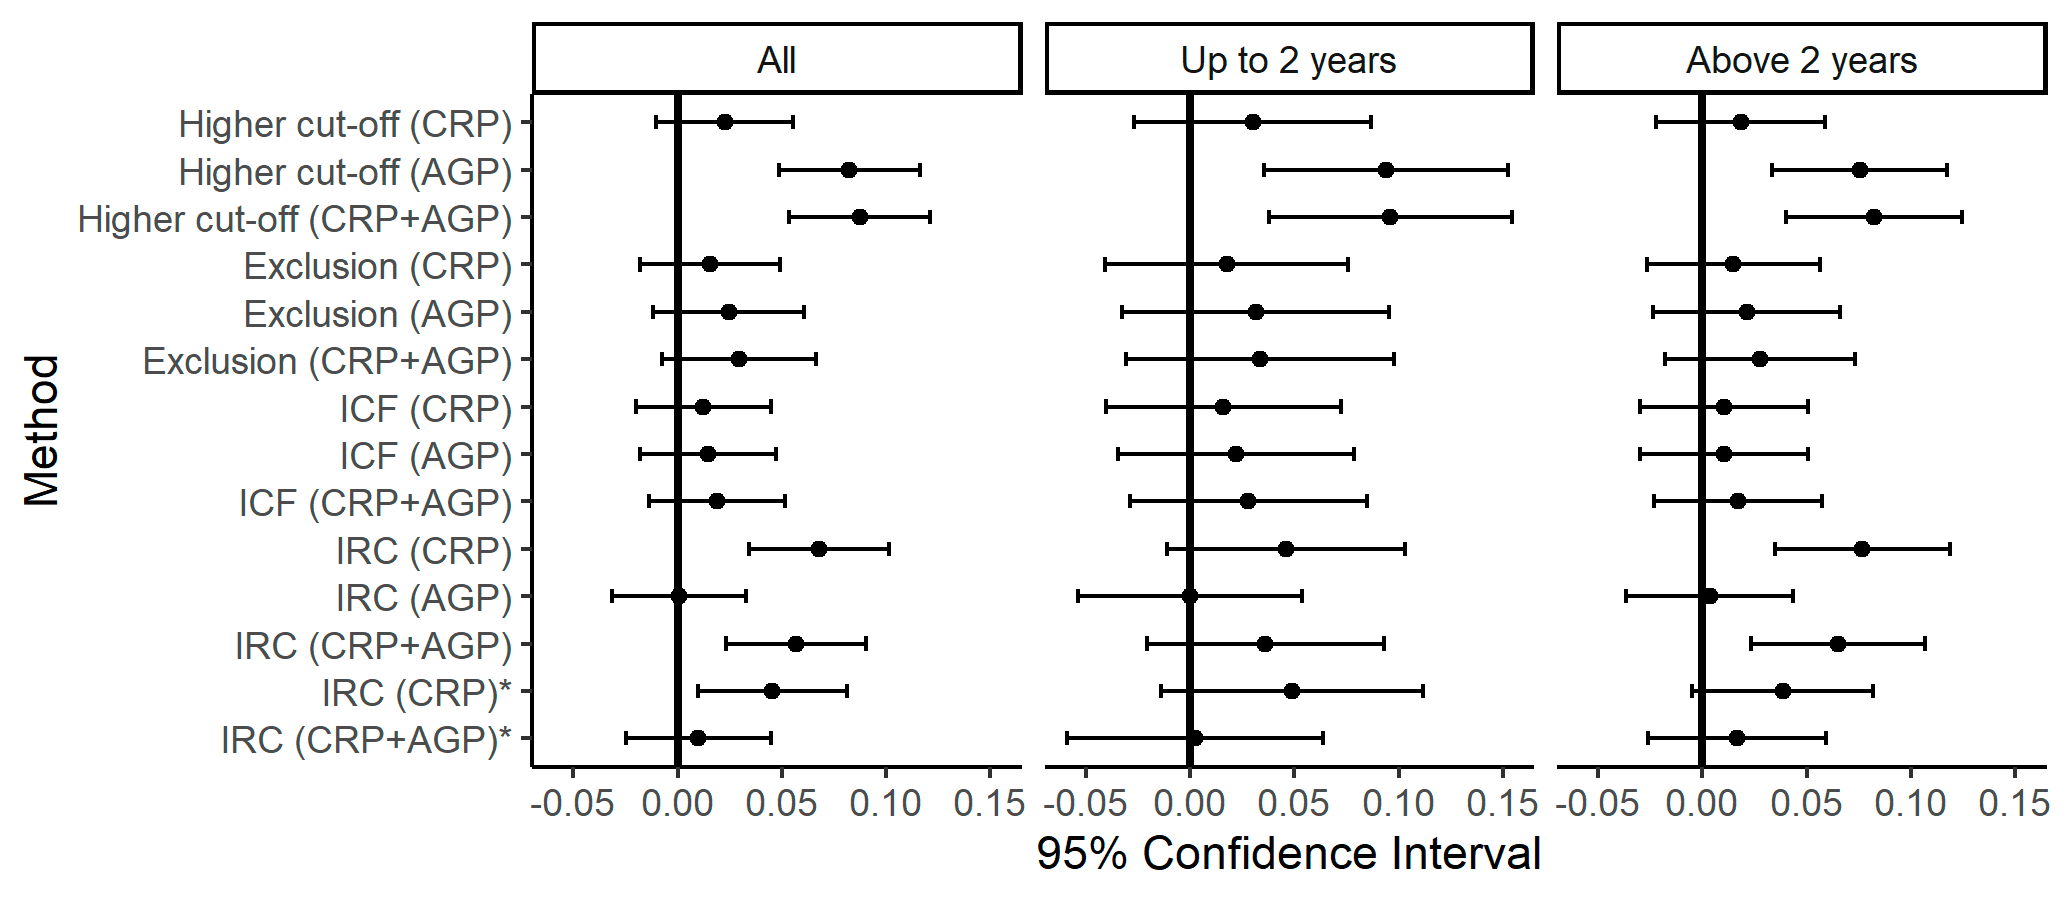
Before making decisions based on these results, it is important to consider the margin of error in relation to a specific estimation of differences between unadjusted prevalences and those adjusted for inflamation. Figure 1 summarizes the CI of such differences, as estimated by each method. For example, in studies considering all children in the sample, the specific estimation of the difference between the unadjusted prevalence and the prevalence adjusted by the higher cut-off (CRP) approach is 0.02 and a 95% CI ensures us that the population difference is in the range of –0.01–0.056.
Intervals corresponding to the higher cut-off point approach, where AGP is considered either alone or combined with CRP, do not contain the zero value. This indicates that the unadjusted iron deficiency prevalence is significantly different from the adjusted prevalence (95% CI). In all intervals corresponding to differences between unadjusted and adjusted prevalences by exclusion or ICF approaches, the range of values includes differences that are not significant. Differences between the unadjusted prevalence and prevalences adjusted by the IRC method (whether considering CRP alone, or CRP + AGP, as explanatory variables) are significant.
Stratified analyses yield very wide CIs for the whole sample and for both age groups.
Table 4: Univariate and multivariate regression models of ln(ferritin) concentrations and inflammation markers, by subpopulation
The values of the columns named intercept, ln(CRP, mg/L) and ln(AGP, g/L) are specific estimations of each model’s coefficients. AGP (g/L); CRP (mg/L); LOD of the CRP (0.1 mg/L). CRP and AGP were included in the models as log-transformed covariables. The regression coefficients (except for the intercept), indicate the change in ln(ferritin) associated with the change in ln(CRP) or ln(AGP) per one unit, since the rest of the variables remain constant. Column p contains the values associated with the significance tests of the regression coefficients.
DISCUSSION Chronic inflammation (assessed by AGP) was more frequent than acute inflammation, although with concentrations only slightly above the cut-off point. The highest inflammation rates diagnosed by AGP have been reported in Asian and African countries by the BRINDA study.[23]
Nonetheless, even though high CRP levels were found only in about 10% of children in the study, some had concentrations much higher than the cut-off point. Chronic inflammation, assessed by AGP, is associated with a higher frequency of obesity and asthma in children[18] and high CRP values are associated with systemic bacterial infections, tissue damage and allergies.[14] Asymptomatic infections in children can also increase CRP and AGP.[18]
Cuba is a Caribbean island country in the tropics, with high temperatures and high relative humidity, which favors development of infectious disease.[24,25] Children aged <5 years show the highest rates of ADD and ARI.[26] The main causes of ADD in Cuba are rotaviruses and noroviruses;[27] for ARI the main cause is rhinovirus, and human sincitial respiratory virus in children aged <1 year.[28]
The norovirus as a cause of inflammation was described in a longitudinal study in infected adults.[29] A paper on preschool children in Gambia[30] observed that iron-deficiency anemia was associated even with the low degree of inflammation produced by respiratory infections. These viral infections should therefore be considered in assessing inflammation and estimating iron deficiency.
Iron deficiency rates estimated in this study, without adjusting for inflammation, are lower than in previous studies. This may be due to the effect of food and nutritional intervention programs existing in Cuba.[31,32] In studies of preschool children in Havana[3] and in Cuba’s eastern provinces[4,5] iron deficiency was found to be one of the main risk factors associated with anemia (ferritin <10 mg/L in 41.8% of those in Havana, 38.6% in the provinces of Santiago de Cuba, Holguín, Granma and Las Tunas, and 57.6% in Guantánamo). However, the cut-off point used to define iron deficiency through ferritin was lower, and in those studies inflammation was not assessed as a factor influencing increased serum ferritin levels.
Approximately 50% of main acute-phase proteins (such as ferritin) are related to transportation of nutrients or regulation of nutrient concentration.[18] At times or conditions in which there is asymptomatic inflammation, a protective mechanism involving nutrient sequestering has been proposed. In this case, increased ferritin levels will limit the availability of iron for pathogen growth or function.[33] Evaluating the relationship between inflammation and ferritin is fundamental for more accurate estimations of iron deficiency in the population.
Inflammation-adjusted ferritin concentrations increased iron deficiency prevalence in Cuban preschool children. Adjusted prevalence showed high variability among different approaches, ranging from 0.1 to 8.8 percentage points, similar to that obtained in a previous study.[34] As discussed in BRINDA, each approach has advantages and disadvantages.[20]
We found that correcting ferritin levels for inflammation using an increased cut-off point yielded an important change in the estimation of iron deficiency prevalence as compared to unadjusted estimations. In this approach, AGP exerts the highest influence, since almost one third of the sample had high AGP values. Note that increasing the cut-off point may lead to a reduction in biomarker specificity by increasing the proportion of false negatives.[35]
Fig 1: Diferences in proportions and confidence intervals (95%) between the methods with unadjusted values. Cuba 2015–2018.
Footnote: Differences in proportions and confidence intervals (95%) to test the proportion comparison hypothesis for the prevalence of iron deficiency without adjustment and after applying the methods used to adjust the ferritin concentrations in the presence of inflammation. The approach using the increase of the cut-off point (Higher cut-off; AGP + CRP) considers individuals with high concentrations of the inflammation biomarkers (concentrations of CRP >5 mg/L and AGP >1 g/L) with iron deficiency if the ferritin concentrations are <30 mg/L. The exclusion approach (Exclusion; AGP + CRP) discards the individuals with high concentrations of inflammation biomarkers (concentrations of CRP > 5mg/L and AGP >1 g/L) and it calculates the prevalence of iron deficiency for individuals without inflammation. The internal correction factor (ICF-AGP+CRP) uses mathematical correction factors. The correction factors are defined as the ratio between the geometric mean of the values of ferritin in the reference group (CRP and AGP are not high) and the geometric mean of ferritin of each inflammation group. The correction through regression approach (IRC-AGP + CRP) uses linear regression to adjust the concentration of serum ferritin with the concentrations of CRP and AGP as continuous predictors. The asterisk (*) denotes the exclusion from the analysis of the individuals censored by CRP (Values of CRP <0.1 mg/L, LOD).
The exclusion approach increased iron deficiency prevalence estimation but resulted in a loss of precision due to an almost one-third reduction in sample size (by excluding children with high CRP + AGP). Iron deficiency rates obtained by using either CRP or AGP alone yielded very similar prevalence estimates to those obtained when using the biomarkers together.
ICF has the advantage of using correction factors calculated specifically for Cuban preschool children. Sample sizes in the study separated by inflammation group (or by groups in which CRP and AGP were analyzed separately) were large enough to accurately estimate correction factors for inflammation.
Ferritin concentrations increased during periods of inflammation, mainly during the incubation period and early convalescence. During late convalescence, ferritin concentration decreased slightly when compared to the group where there was no inflammation. Hence, in the ICF approach, AGP has a smaller effect on iron deficiency prevalence adjustment.
IRC uses linear regression to adjust ferritin according to CRP and AGP concentrations on a continuous scale. It also has the advantage of using internal reference values calculated from the sample of Cuban preschool children. This approach led to an important decrease in ferritin concentration estimations.The IRC approach yielded higher estimates of iron deficiency prevalence than the ICF approach.
In contrast, the IRC approach requires more careful analytical interpretation. The quality of the models should be evaluated by how well they describe the relationship between inflammation biomarkers (CRP and AGP) and ferritin values Coefficient (slope) estimations of univariate regression models with AGP as a single predictor were all non-significant, suggesting that AGP does not have a linear effect on ferritin concentration. When AGP is included in the multivariate model (IRC, CRP and AGP), iron deficiency prevalence differs by only 1.1% compared to the univariate model (IRC–CRP) (29.8%). This result differs from the literature concerning the expected positive relationship between ferritin and AGP as an indicator of inflammation.[20,21] Before making decisions that may lead to erroneous judgments, non-linear regression models must be assessed in future studies, as the effect of inflammation biomarkers on ferritin measurements could change when AGP values increase.
Iron deficiency prevalence estimates were lower when censored data was excluded, but slightly higher than the unadjusted value. This contrasts with other findings,[21] where ignoring censored data of CRP <LOD produced a substantial bias in iron deficiency estimates.
The difference between unadjusted and adjusted prevalences for inflammation by the highest cutoff approach showed statistically non-significant differences when ferritin concentrations were adjusted for CRP alone. When considering AGP in the analysis, the intervals for AGP and CRP + AGP are practically equal, therefore including CRP will not provide any benefit to the adjusted prevalence. Using the exclusion approach, no significant differences were found in any case, but before making decisions based on the statistical results, it should be taken into account that the interval corresponding to the CRP + AGP case includes positive differences with important practical implications that must be evaluated.
In the IRC approach, differences between adjusted and unadjusted prevalences are statistically significant, both when considering CRP alone or with CRP + AGP. However, significant results would not justify the use of adjusted prevalences or efforts to measure and include AGP. It should be noted that when both biomarkers were included in the linear regression model, both coefficients were significant, but AGP’s effect turned negative.
As shown in other studies,[14,18] this research supports the hypothesis that the magnitude of ferritin concentration change depends on inflammation stage. From these results we concluded that it was necessary to adjust ferritin concentrations according to inflammation, since, if unadjusted, iron deficiency prevalence may be underestimated.[34] However, the results also support the conclusion that we should search for other models that enable the study of the effects of inflammation at higher ferritin concentrations. This study is the first time that measurements of both inflammation biomarkers (CRP and AGP) and iron deficiency (by ferritin) in Cuban preschool children are included. Information on the prevalence of these factors in Cuba provides new insights that could allow decision-makers to adjust Cuba’s childhood nutrition programs.
One study limitation is that data were taken from a national sample from selected provinces. In addition, its cross-sectional nature precludes the analysis of any seasonal influence of inflammation on ferritin concentrations .
CONCLUSIONS One third of preschool children in the sample had elevated indicators of inflammation. This study confirms that inflammation is a confounding factor in estimating iron status during the first four years of life. Ignoring inflammation would result in underestimating iron deficiency prevalence in Cuban preschool children. The IRC approach would be appropriate in epidemiological studies because it takes into account inflammation severity. This study is a first step in the search for models that could better account for the effects of inflammation in estimating ferritin concentrations.
Acknowledgments We are grateful to staff at the Provincial and Municipal Hygiene, Epidemiology and Microbiology Centers in each province where the work was carried out: Dr Armando Cruz Ramos, Dr Mercedes Elisa Vals, Dr Lídice Bermúdez Herrera, Dr Leandro Cancio Fonseca, Nerys Domínguez López, Dr Karelia Paulí Hechavarría, Damaryz Mendoza Flores, Dr Clarisa Hernández Fernández, Clara de la Rosa Brau, Maile Díaz Espinosa, Dr Olidia Hernández Leyva, Mitzy Ordóñez Casares, Dania Gómez Llopis, Yuneidys Suárez Parra, and Dr Susana Emilia Cardero Pacheco.
We would also like to thank those who participated in the project’s fieldwork: Derbis Campos Hernández, Maytell de la Paz Luna, Elaine Diez López, and the laboratory technicians Caridad Arocha Oriol, Dania Herrera Javier, as well as the laboratory technicians who took blood samples in the provinces. Thanks are also due to Yamilia Garriga from CPM for her support in laboratory work.
Global Burden of Disease 2015 Disease and Injury Incidence and Prevalence Collaborators. Global, regional, and national incidence, prevalence, and years lived with disability for 310 diseases and injuries, 1990-2015: a systematic analysis for the Global Burden of Disease Study 2015. Lancet [Internet]. 2016 Oct 8 [cited 2020 Mar 6];388(10053):1545–602. Available at: https://doi.org/10.1016/S0140-6736(16)31678-6
Stevens GA, Finucane MM, De-Regil LM, Paciorek CJ, Flaxman SR, Branca F, et al. Global, regional, and national trends in haemoglobin concentration and prevalence of total and severe anaemia in children and pregnant and non-pregnant women for 1995–2011: a systematic analysis of population-representative data. Lancet Glob Health. 2013 Jul;1(1):e16–25. DOI: 10.1016/S2214-109X(13)70001-9
Gay Rodríguez J, Reboso Pérez JG, Cabrera Hernández A, Hernández Triana M, Letelier Chong A, Sánchez MA. Anemia nutricional en un grupo de niños aparentemente sanos de 2 a 4 años de edad. Rev Cubana Aliment Nutr. 2002 Jan–Jul;16(1):31–4. Spanish.
Reboso J, Jiménez Acosta S, Monterrey P, Macías C, Pita G, Selva L, et al. Diagnóstico de la anemia por deficiencia de hierro en niños de 6 a 24 meses y de 6 a 12 años de edad de las provincias orientales de Cuba. Rev Esp Nutr Comunitaria. 2005;11(2):60–8. Spanish.
Reboso Pérez J, Cabrera Núñez E, Pita Rodríguez G, Jiménez Acosta S. Anemia por deficiencia de hierro en niños de 6 a 24 meses y de 6 a 12 años de edad. Rev Cubana Salud Pública. 2005 Sep–Dec;31(4):306–12. Spanish.
Pita-Rodríguez G, Basabe-Tuero B, Díaz-Sánchez ME, Mercader-Camejo O, Reboso-Pérez J, Carrillo-Selles M, et al. Progreso en la reducción de la anemia en niños y niñas de un año de edad en La Habana entre los años 2005 y 2007. Nutr Clin Diet Hosp. 2012 Jan–Apr; 32(1):13–25. Spanish.
World Health Organization; Center for Disease Control and Prevention. Assessing the iron status of populations: including literature reviews: report of a Joint World Health Organization/Centers for Disease Control and Prevention Technical Consultation on the Assessment of Iron Status at the Population Level, Geneva, Switzerland, 6-8 April 2004, 2nd ed [Internet]. Geneva: World Health Organization; 2007 [cited 2020 Mar 6]. 112 p. Available at: https://apps.who.int/iris/handle/10665/75368
Witte DL. Can serum ferritin be effectively interpreted in the presence of the acute-phase response? Clin Chem [Internet]. 1991 Apr 1 [cited 2020 Mar 6];37(4):484–5. Available at: https://doi.org/10.1093/clinchem/37.4.484
Beard JL, Murray-Kolb LE, Rosales FJ, Solomons NW, Angelilli ML. Interpretation of serum ferritin concentrations as indicators of total-body iron stores in survey populations: the role of biomarkers for the acute phase response. Am J Clin Nutr [Internet]. 2006 Dec 1 [cited 2020 Mar 6];84(6):1498–505. Available at: https://doi.org/10.1093/ajcn/84.6.1498
Darboe MK, Thurnham DI, Morgan G, Adegbola RA, Secka O, Solon JA, et al. Effectiveness of an early supplementation scheme of high-dose vitamin A versus standard WHO protocol in Gambian mothers and infants: a randomised controlled trial. Lancet [Internet]. 2007 Jun 23 [cited 2020 Mar 6];369(9579):2088–96. Available at: https://doi.org/10.1016/S0140-6736(07)60981-7
Gibson RS, Abebe Y, Stabler S, Allen RH, Westcott JE, Stoecker BJ, et al. Zinc, gravida, infection, and iron, but not vitamin B-12 or folate status, predict hemoglobin during pregnancy in Southern Ethiopia. J Nutr. 2008 Mar;138(3):581–6. DOI: 10.1093/jn/138.3.581
World Health Organization. Serum ferritin concentrations for the assessment of iron status and iron deficiency in populations. Vitamin and Mineral Nutrition Information System (WHO/NMH/NHD/MNM/11.2) [Internet]. Geneva: World Health Organization; 2011 [cited 2014 Jul 5]. 5 p. Available at: http://www.who.int/vmnis/indicators/serum_ferritin.pdf
Raiten DJ, Ashour FAS, Ross AC, Meydani SN, Dawson HD, Stephensen CB, et al. Inflammation and Nutritional Science for Programs/Policies and Interpretation of Research Evidence (INSPIRE). J Nutr. 2015 May;145(5):1039S–108S.
Petri N, Olofin I, Hurrell RF, Boy E, Wirth JP, Moursi M, et al. The proportion of anemia associated with iron deficiency in low, medium, and high human development index countries: a systematic analysis of national surveys. Nutrients [Internet]. 2016 Nov 2 [cited 2020 Mar 10];8:693. Available at:https://doi.org/10.3390/nu8110693
Council of Ministers Executive Committee (CU). Acuerdo No. 15-08. Plan integral para la prevención y el control de la anemia por deficiencia de hierro en Cuba. Havana: Council of Ministers Executive Committee (CU); 2008. Spanish.
Domínguez-Alonso E, Zacca E. Sistema de salud de Cuba. Salud Pública Méx. 2011;53(Suppl 2):S168–S76.
Thurnham DI, McCabe LD, Haldar S, Wieringa FT, Northrop-Clewes CA, McCabe GP. Adjusting plasma ferritin concentrations to remove the effects of subclinical inflammation in the assessment of iron deficiency: a meta-analysis. Am J Clin Nutr [Internet]. 2010 [cited 2020 Mar 6];92(3):546–55. Available at: https://doi.org/10.3945/ajcn.2010.29284
R Core Team. R: A Language and Environment for Statistical Computing. Vienna: R Foundation for Statistical Computing; 2019.
Namaste SM, Aaron GJ, Varadhan R, Peerson JM, Suchdev PS; BRINDA Working Group. Methodologic approach for the biomarkers reflecting Inflammation and Nutritional Determinants of Anemia (BRINDA) Project. Am J Clin Nutr. 2017;106(Suppl 1):333S–47S. DOI: 10.3945/ajcn.116.142273
Mwangi MN, Echoka E, Knijff M, Kaduka L, Werema BG, Kinya FM, et al. Iron status of Kenyan pregnant women after adjusting for inflammation using BRINDA regression analysis and other correction methods. Nutrients. 2019 Feb 16;11(2):420. DOI: 10.3390/nu11020420
World Medical Association Declaration of Helsinki. Ethical principles for medical research involving human subjects. Bull World Health Organ. 2013;310(20):2191–4. DOI: 10.1001/jama.2013.281053
Namaste SML,Ou J, Williams AM, Young MF, Yu EX, Suchdev Adjusting iron and vitamin A status in settings of inflammation: a sensitivity analysis of the Biomarkers Reflecting Inflammation and Nutritional Determinants of Anemia (BRINDA) approach. Am J Clin Nutr [Internet]. 2020 Aug 4 [cited 2021 Mar 6];112 (Supp 1):458S–67S. Available at: https://doi.org/10.1093/ajcn/nqaa141
Paynter S. Humidity and respiratory virus transmission in tropical and temperate settings. Epidemiol Infect. 2015;143(6). 1110–8. DOI: 10.1017/S0950268814002702
Lanata CF, Black RE. Diarrheal Diseases. Chapter 6. In: Semba RD, Bloem MW, editors. Nutrition and Health in developing countries 2nd ed. Totowa (US): Humana Press; 2008 139–78.
National Health Statistics and Medical Records Division (CU). Anuario Estadístico de Salud 2018. Havana: Ministry of Public Health (CU); 2019. Spanish.
Ribas MA, Castaño Y, Martínez MD, Tejero Y, Cordero Y. Norovirus and Rotavirus infection in children aged less than five years in a paediatric hospital, Havana, Cuba. Braz J Infec Dis. 2015 Mar–Apr;19(2):222–3.
Borroto S, Valdés O. Vigilancia de infecciones respiratorias agudas. Cuba, 2018. BOLIPK [Internet]. 2019 Feb 4 [cited 2020 Feb 17];29(3):17–24. Available at: http://files.sld.cu/ipk/files/2019/04/Vol-29-03.pdf. Spanish.
Williams AM, Ladva CN, Leon JS, Lopman BA, Tangpricha V, Whitehead RD, et al. Changes in micronutrient and inflammation serum biomarker concentrations after a norovirus human challenge. Am J Clin Nutr. 2019 Dec 1;110(6):1456–64. DOI: 10.1093/ajcn/nqz201
Prentice AM, Bah A, Jallow MW, Jallow AT, Sanyang S, Sise EA, et al. Respiratory infections drive hepcidin-mediated blockade of iron absorption leading to iron deficiency anemia in African children. Sci Adv. 2019 Mar 27;5(3). DOI: 10.1126/sciadv.aav9020
Apoyo al Plan Nacional para la Prevención y Control de la Anemia en niños menores de 5 años de las cinco provincias orientales (2008-2012). Programa Mundial de Alimentos. Proyecto de Desarrollo Cuba 10589 Apoyo al Plan Nacional para la prevención y el Control de la Anemia en las cinco provincias orientales de Cuba [Internet]. Roma: Programa Mundial de Alimentos; 2007 Oct [cited 2010 Oct 25]. Available at: http://www.onu.org.cu/pma/proyectos.asp. Spanish.
Apoyo a la lucha contra la anemia en grupos vulnerables en Cuba. Ventana temática: infancia, seguridad alimentaria y nutrición. Naciones Unidas. Programa conjunto. Apoyo a la lucha contra la anemia en grupos vulnerables en Cuba [Internet]. New York: United Nations; 2009 Sep [cited 2010 Oct 20]. Available at: http://www.mdgfund.org/sites/default/files/Signed_JP_Cuba_Children_29Sept09.pdf. 80 p. Spanish.
Namaste SM, Rohner F, Huang J, Bhushan NL, Flores-Ayala R, Kupka R, et al. Adjusting ferritin concentrations for inflammation: Biomarkers Reflecting Inflammation and Nutritional Determinants of Anemia (BRINDA) project. Am J Clin Nutr [Internet]. 2017 Jul [cited 2020 Oct 25];106(Suppl 1):359S–71S. Available at: https://doi.org/3945/ajcn.116.141762
Raghavan R, Ashour FS, Bailey R. A review of cutoffs for nutritional biomarkers. Adv Nutr. 2016 Jan 15;7(1):112–20. DOI: 10.3945/ajcn.116.141762.
THE AUTHORS
Gisela María Pita-Rodríguez (Corresponding author: nuevamia2002@yahoo.com, gmpita@infomed.sld.cu), physician specializing in clinical biochemistry with a master’s degree in environmental health. Associate researcher and professor. Head, Nutritional Anemia Laboratory, National Hygiene, Epidemiology and Microbiology Institute (INHEM), Havana, Cuba. https://orcid.org/0000-0002-5590-2461
Cristina Chávez-Chong, mathematician with a master’s degree in statistics. Assistant researcher, Mathematics Department, Institute of Mathematical Cybernetics and Physics, Havana, Cuba. https://orcid.org/0000-0002-2719-9246.
Brenda Lambert-Lamazares, mathematician. Mathematics Department, Institute of Mathematical Cybernetics and Physics, Havana, Cuba. https://orcid.org/0000-0001-9546-5545
Minerva Montero-Díaz, mathematician with a master’s degree in mathematical sciences (statistical mention) and a PhD in mathematical sciences. Senior researcher. Mathematics Department, Institute of Mathematical Cybernetics and Physics, Havana, Cuba. https://orcid.org/0000-0003-2108-5499.
Rolando Selgas-Lizano, mathematician, Mathematics Department, Institute of MathematicalCybernetics and Physics, Havana, Cuba. https://orcid.org/0000-0002-3165-0888.
Beatriz Basabe-Tuero, biochemist with a master’s degree in public health nutrition and a doctorate in nutrition sciences. Full professor and associate researcher, INHEM, Havana, Cuba. https://orcid.org/0000-0002-9076-5794X.
María Elena Díaz-Sánchez, biologist with a master’s degree in anthropology and a doctorate in health sciences. Full professor and senior researcher, INHEM, Havana, Cuba. https://orcid.org/0000-0003-0735-4787.
No new Early Online articles at this time. The most recent articles are listed in the Current Issue Table of Contents. Early Online articles are added as soon as they are available, so please check back later.