INTRODUCTION It would be useful to have diagnostic indices for obesity phenotypes in pregnant women based on morphological traits and the specific distribution of abdominal adipose tissue. This type of practical resource would allow for the classification of obesity phenotypes in normal-weight women in early pregnancy and would contribute to primary healthcare followup of pregnant women.
OBJECTIVES Validate a new diagnostic index for the metabolically unhealthy obese, normal-weight phenotype, as a determinant for cardiometabolic risk in normal-weight pregnant Cuban women in the first trimester of pregnancy.
METHODS A cross-sectional study of 526 pregnant women at a gestational age of 12 to 14 weeks seen at the ultrasound service of the Chiqui Gómez Lubián Teaching Polyclinic, Santa Clara municipality, Villa Clara province, Cuba, was conducted from January 2016 through July 2020. Subcutaneous, preperitoneal and visceral abdominal fats, as well as anthropometric and blood chemistry variables, were measured. The women were divided into three groups based on metabolic phenotypes, taking into account body mass index in the normal weight range, visceral adiposity index values and the lipid accumulation product starting at the 75th percentile.
The new index, called the abdominal adipose deposit index, was obtained by multiplying the subcutaneous fat thickness by visceral fat thickness, both measured by ultrasound. A cutoff point was established that facilitated discernment of an unhealthy phenotype: normal weight but metabolically obese, a cardiometabolic risk factor.
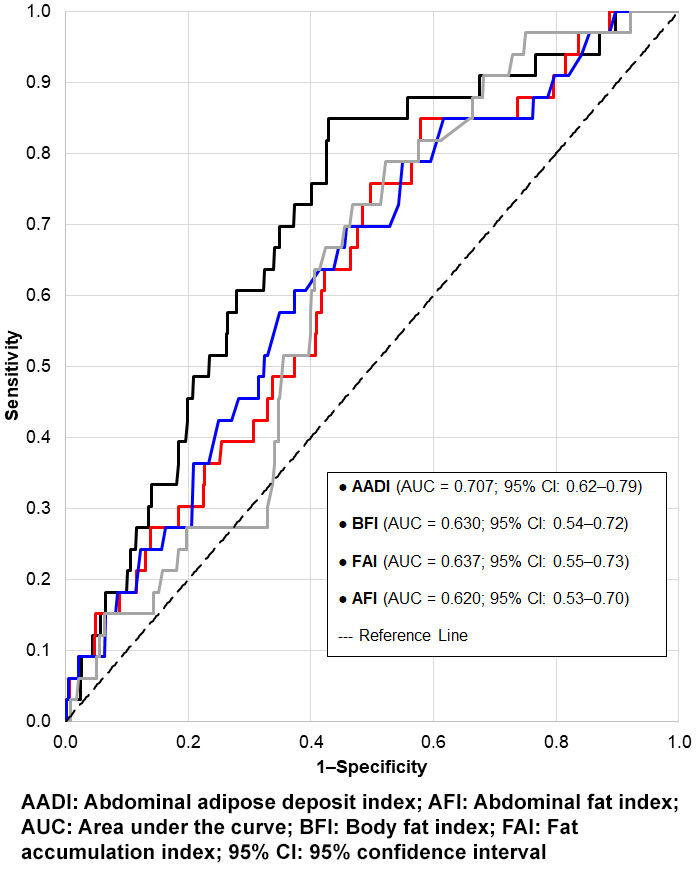
RESULTSReceiver operating characteristic (ROC) analysis of the abdominal adipose deposit index to distinguish the metabolically unhealthy obese, normal-weight phenotype in normal-weight pregnant women showed an area under the curve of 0.707 (95% CI: 0.62‒0.79, p <0.001), greater than that of the body fat index (0.630; 95% CI: 0.54‒0.72), the fat accumulation index (0.637; 95% CI: 0.55‒0.73) and other established ultrasound indices of abdominal adiposity, with a prevalence of 6.3%.
CONCLUSIONS The abdominal adipose deposit index is better than other traditional indicators at detecting the risk of metabolic obesity in early pregnancy in normal-weight women, facilitating early intervention in clinical practice to prevent or delay progression of cardiometabolic disease in these women.
ABSTRACT INTRODUCTIONIt would be useful to have diagnostic indices for obesity phenotypes in pregnant women based on morphological traits and the specific distribution of abdominal adipose tissue. This type of practical resource would allow for the classification of obesity phenotypes in normal-weight women in early pregnancy and would contribute to primary healthcare followup of pregnant women.
OBJECTIVE Validate a new diagnostic index for the metabolically unhealthy obese, normal-weight phenotype, as a determinant for cardiometabolic risk in normal-weight pregnant Cuban women in the first trimester of pregnancy.
METHODS A cross-sectional study of 526 pregnant women at a gestational age of 12 to 14 weeks seen at the ultrasound service of the Chiqui Gómez Lubián Teaching Polyclinic, Santa Clara municipality, Villa Clara province, Cuba, was conducted from January 2016 through July 2020. Subcutaneous, preperitoneal and visceral abdominal fats, as well as anthropometric and blood chemistry variables, were measured. The women were divided into three groups based on metabolic phenotypes, taking into account body mass index in the normal weight range, visceral adiposity index values and the lipid accumulation product starting at the 75th percentile.The new index, called the abdominal adipose deposit index, was obtained by multiplying the subcutaneous fat thickness by visceral fat thickness, both measured by ultrasound. A cutoff point was established that facilitated discernment of an unhealthy phenotype: normal weight but metabolically obese, a cardiometabolic risk factor.
RESULTS Receiver operating characteristic (ROC) analysis of the abdominal adipose deposit index to distinguish the metabolically unhealthy obese, normal-weight phenotype in normal-weight pregnant women showed an area under the curve of 0.707 (95% CI: 0.62‒0.79, p <0.001), greater than that of the body fat index (0.630; 95% CI: 0.54‒0.72), the fat accumulation index (0.637; 95% CI: 0.55‒0.73) and other established ultrasound indices of abdominal adiposity, with a prevalence of 6.3%.
CONCLUSIONS The abdominal adipose deposit index is better than other traditional indicators at detecting the risk of metabolic obesity in early pregnancy in normal-weight women, facilitating early intervention in clinical practice to prevent or delay progression of cardiometabolic disease in these women.
INTRODUCTION Consensus is lacking on clinical management of obesity during pregnancy as there is not consistent evidence justifying one or another change in this regard. The prominence of adipose tissue in the genesis of metabolic and cardiovascular complications related to obesity[1] has increasingly drawn interest to the differentiation between specific adipose tissue depots due to their association with obesity phenotypes that contribute to development of type 2 diabetes and cardiovascular disease.[2]
The body’s response to central adiposity is complex. Under conditions of obesity, visceral adipose tissue becomes the first store of triglycerides when faced with the inability of subcutaneous adipose tissue to store such excess energy (‘overflow hypothesis’), which causes lipotoxicity and insulin resistance (IR). According to some researchers, subcutaneous adipose tissue is related to and influences IR, at least as much or more than perivisceral adiposity. Subcutaneous adipose tissue possesses a considerably higher adipose mass, which influences insulin sensitivity due to the volume of free fatty acids that it sends into general circulation, considered an insulin resistance phenomenon via a non-portal mechanism.[3,4]
IMPORTANCE Based on ultrasound measurement of abdominal fat, an index was obtained to diagnose an unhealthy (metabolically obese, normal-weight) phenotype in early pregnancy, facilitating identification and prevention of cardiometabolic risk in pregnant women.
The essential mechanism for development of metabolically abnormal phenotypes is disruption in the ability of subcutaneous tissue adipocytes to proliferate and differentiate, which leads to a limitation of adipocyte hyperplasia and to adipocyte hypertrophy, with an increase in the flow of fatty acids to the visceral adipose tissue and consequent accumulation of fat in other ectopic tissues. This represents an emerging clinical problem that in the near future may materialize as higher rates of ‘healthy obese’ and ‘thin sick’ individuals, which require coordination of diagnostic criteria on metabolic phenotypes with other studies that examine the relevance of the various definitions and findings.[5]
During pregnancy, when waist circumference is changing significantly, different criteria have been used to classify metabolic syndrome (MetS). Its high prevalence, the metabolic risks caused by the physiological changes of pregnancy and postpartum, the lack of indicators to classify the syndrome, as well as inconsistencies regarding its prevalence and associated factors in women with no prior diseases, support the need for research on the subject.[6]
The US National Cholesterol Education Program Adult Treatment Panel III (NCEP-ATP III) criteria,[7] which include abdominal obesity as an independent risk factor for cardiometabolic disease,[8] have been used to predict MetS in pregnant women due to the simplicity of their application.
Few studies have researched central adipose tissue deposits and glucose homeostasis in pregnancy.[9] An obese woman has a metabolic increase of IR in early pregnancy, with results such as glucose intolerance and fetal overgrowth, that clinically manifest in late pregnancy. While a single mechanism has not been identified to explain the adverse perinatal results associated with maternal obesity, nonetheless maternal pregestational insulin resistance, inflammation and oxidative stress could contribute to early placental insufficiency.[10]
Ultrasonography has often been used as a necessary substitute for waist circumference measurements during pregnancy.[11] These measurements, together with the usual first trimester ultrasound examination, may provide additional information more useful than body mass index (BMI) regarding association with cardiometabolic risk factors and IR.[12]
Evidence shows that ultrasonographic indices of abdominal adiposity, such as abdominal fat index (AFI),[13] fat accumulation index (FAI),[14] body fat index (BFI)[15] and others, combined with use of anthropometric measurements and laboratory studies such as visceral adiposity index (VAI),[16] are better cardiometabolic risk indicators than BMI. However, despite the existence of cutoff points that appear optimal for diagnosing obesity and MetS, studies in several countries and ethnic groups have arrived at different conclusions.[17] No single definition exists for the metabolically obese phenotype in a normal-weight pregnant woman. This makes it difficult to compare results[18] or to apply them to the Cuban population, least of all to pregnant Cuban women.
There are no studies on abdominal adiposity using ultrasound (US) in Cuba, despite its wide availability in our healthcare institutions, and thus its potential to diagnose obesity has not yet been reached, particularly in early pregnancy.
Considering that some cardiometabolic risk factors can be identified using obesity phenotypes,[19] creating a new abdominal adipose deposit index (AADI) based on direct measurement of subcutaneous and visceral fat using US and its validation in the first trimester of pregnancy, would provide an instrument for early differentiation of such risks in this population group,[6,20,21] and would support a new clinical approach for managing obesity and its implications during pregnancy.
The objective of this study was to validate a new diagnostic index to determine a metabolically-unhealthy and obese phenotype in normal-weight pregnant women in Cuba, as an indicator of cardiometabolic risk in early pregnancy.
METHODS Design and population A cross-sectional study was conducted with 2357 women of all nutritional statuses in the first trimester of pregnancy from various community polyclinic catchment areas in Santa Clara municipality, Villa Clara province, Cuba, seen at the Prenatal Ultrasound Service of the Chiqui Gómez Lubián Teaching Polyclinic, from January 2016 through June 2020. The study population comprised 526 pregnant women after applying the following criteria:
Inclusion criteriaClassified as normal weight according to BMI, aged 20–35 years, pregnant with a single fetus and at a gestational age of 12–14 weeks (confirmed by US).
Exclusion criteria Presence of metabolic disease including diabetes mellitus in any of its stages, dyslipidemia, psychiatric disorders, uterine fibroids and regular consumption of prescription drugs.
Exit criteria Termination or loss of pregnancy and incomplete or unreliable data.
Study variables Ultrasound variables and their determination Thickness in millimeters (mm) of subcutaneous abdominal fat (SAF), preperitoneal fat (PPF) and visceral fat (VF) were measured by US. SAF was measured in the upper half of the anterior abdominal wall above the umbilicus, for which a longitudinal scan was done perpendicular to the skin, at the lowest point between the wall and the linea alba at the level of the xiphoid process. PPF was measured at the maximum point, behind the anterior abdominal wall and at the level of the xiphoid process, between the linea alba and the peritoneum that covers the liver surface, placing the transducer perpendicular to the skin. SAF thickness was obtained by placing the electronic cursors located in the skin-fat interface (excluding the skin) to the linea alba; to measure PPF thickness, cursors were placed in the fat-muscle interface, between the linea alba and the liver surface, keeping them almost parallel to the skin, according to the Suzuki technique.[13] To measure VF, cursors were placed at the internal edge of the rectus abdominis muscle, without including it, and at the anterior edge of the spine, at the level of the fourth lumbar vertebra (L4‒L5), placing the transducer between one and two centimeters above the umbilicus, according to Armellini.[22] No standardized cutoff points or reference values have been reported for these variables in pregnancy.
Abdominal adipose deposit index (AADI) The new index proposed in this study was obtained by multiplying the thickness of the subcutaneous fatty tissue by the thickness of visceral fatty tissue, both measured by ultrasound: AADI = SAF × VF. The AADI result is expressed in mm2 and includes both fatty depots, which are anatomically and functionally related in their metabolic effects. The creation of this index is supported by theories on the accumulation of abdominal adipose tissue that suggest that the maximum expansion capacity of SAF leads to accumulation of VF, which has been associated with various cardiometabolic risk factors. When the superficial subcutaneous compartment reaches its full capacity for fat storage, the secondary depots, such as the deep subcutaneous and visceral depots, assume the main role in the accumulation of the excess triglycerides, manifested in an increase of the values of this index. As will be indicated later, the cutoff point for the AADI was established at 350 mm2. Values above this threshold identified the metabolically obese, normal-weight phenotype in pregnant women.
Fat accumulation index (FAI) Calculated as the sum of SAF and PPF.[14]
Anterior abdominal wall adiposity index (simplified to abdominal fat index, AFI) Calculated as the quotient between PPF and SAF.[14]
Body fat index (BFI) Calculated by the equation: BFI = (PPF × SAF)/Height.[15]
Anthropometric variables Weight (kg) and height (m) were measured for the BMI calculation when the pregnancy was reported; if a pregnant woman had a value 18.8–25.6 kg/m2 she was classified as normal weight, according to the Anthropometric Pregnancy Tables (one of which is Cuban).[23,24] Waist circumference (WC) was considered a risk indicator at >88 cm.[25]
Combined variables (combination of blood chemistry and/or anthropometric variables) The lipid accumulation product (LAP) and the visceral adiposity index (VAI) were used,[18] for which risk variables were established starting at the 75th percentile of the study population.
All study variables were continuous quantitative variables.
Procedures A high-resolution Sonoacer5 scanner (Samsung Medison Co., Ltd, South Korea) was used for ultrasound measurement of abdominal fat. Measurements were taken by the same specialist—a professional in imaging technique with training in fetal echocardiography and over 15 years’ experience in prenatal US diagnosis. The transducer was placed perpendicular to the skin, after exhalation, with the woman in supine decubitus position, arms at her sides. The defined area from the xifoid process to two centimeters above the umbilicus on the xifo-umbilical line was covered in conductive gel.
To validate AADI, the criteria proposed by the NCEP-ATP III[7] were used as the reference standard test,[27] modifying the cutoff point for blood glucose, with >4.4 mmol/L considered a risk value for pregnant women, according to the Second Cuban Consensus on Diabetes and Pregnancy.[26]
Panel III was selected as reference criteria for AADI validation since there are no risk criteria or standardized cutoff points associated with abdominal obesity and MetS in pregnant women in Cuba. Thus, the rest of the variables were evaluated according to Panel III criteria, also used in the Cuban guide for diagnosis, evaluation and treatment of hypertension.[25] Such criteria, in addition to their simplicity and applicability in the clinical context, have been used successfully by various authors to diagnose MetS in early stages of pregnancy.[6,20,21]
To evaluate AADI’s discriminant ability to detect the metabolically obese, normal-weight phenotype (MONW), as well as MetS, we turned to the Receiver Operating Characteristic (ROC) curve. AADI was used as a contrast variable (test variable), and qualitative variables were selected from the group as explanatory variables, which were assigned numeric values to identify phenotypes or the respective presence or absence of MetS.
The study population was stratified by taking into account BMI values in the normal weight range,[23] and VAI and LAP values starting at the 75th percentile, according to the criteria of Du,[18] including the metabolically healthy obese, normal-weight phenotype (MHONW) as a transition phenotype,[3] resulting in the following groups of metabolic phenotypes:
Metabolically healthy, normal weight (MHNW): 18.8 ≤BMI ≤ 25.6 kg/m2 and VAI <2.37,
Metabolically healthy obese, normal weight (MHONW): 18.8 ≤BMI ≤25.6 kg/m2 and VAI ≥2.37,
Metabolically unhealthy obese, normal weight (MUONW): When criteria for the MHONW phenotype are met and they also have LAP values ≥55.1.
A cutoff point was calculated seeking a balance between sensitivity and specificity, in keeping with the aim of the diagnostic test to identify the highest number of pregnant women with the MUONW phenotype or MetS, as appropriate.
To carry out the validation process, the study population of 526 pregnant women was stratified into two groups, according to presence or not of MetS, based on the modified NCEP-ATP III criteria for the blood glucose cutoff point. A pregnant woman was considered to have MetS if she met three or more of the following conditions: waist circumference >88 cm; fasting glucose >4.4 mmol/L; HDL cholesterol <1.30 mmol/L; triglycerides >1.7 mmol/L and systolic blood pressure >130 mmHg and/or diastolic blood pressure >85 mmHg.[7]
Statistical analysis Information was processed with the IBM SPSS Statistics version 22.0 for Windows and Statgraphics Centurion XV professional software packages.
Analysis of variance (ANOVA) was conducted, and when the null hypothesis that the means are equal was rejected, comparisons were made a posteriori (post hoc) to which Fisher’s least significant difference (LSD) method was applied to identify groups that differed among them.
Summary measures were used to describe quantitative variables, measures of central tendency, dispersion and location (mean and standard deviation, SD) for data with symmetrical distribution, and median and interquartile range (IQR) for non-symmetrical distributions. For qualitative variables, the frequency distributions expressed in absolute and relative values (number and percentage) were calculated.
For all hypothesis testing performed, p value = 0.05 was considered the threshold for statistical significance. Results were presented in tables and figures.
Ethics Written informed consent was provided by all participants, and the anonymity of their personal and clinical data protected. The research was approved by the Chiqui Gómez Lubián Teaching Polyclinic’s Ethics Committee
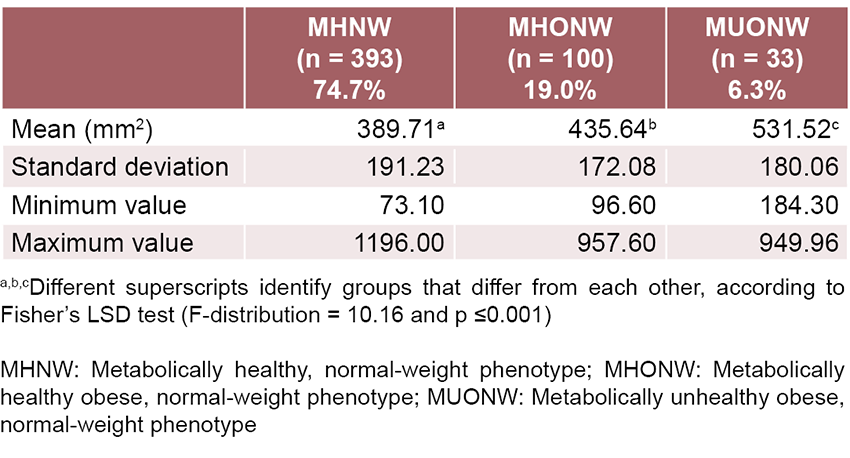
RESULTS Table 1 shows AADI in normal-weight pregnant women who were the subject of the study, based on their metabolic phenotypes. Prevalence of MUONW phenotype was 6.3%.
Through ANOVA analysis, significant differences in AADI were verified between phenotype groups, and an F-distribution value of 10.16 was obtained with an associated p value ≤0.001; likewise, the post hoc multiple range tests by Fisher’s LSD method generated statistically significant differences among all phenotype groups.
Table 1: Descriptive statistics of the abdominal adipose deposit index (AADI) in each metabolic phenotype
Figure 1: ROC curves of ultrasound indicators to distinguish the metabolically unhealthy obese, normal-weight (MUONW) phenotype in normal-weight pregnant women studied
Discriminant capacity of AADI Figure 1 presents the ROC curve which showed the greatest area under the curve for AADI (0.707; 95% CI: 0.62‒0.79, p <0.001).
The cutoff point selected to detect the MUONW phenotype corresponded to an AADI value of 350 mm<sup>2</sup>, located in the graph of Figure 1 at the coordinates Sensitivity = 0.879 (87.9% correctly diagnosed pregnant women) and 1‒Specificity = 0.558 (55.8% false positives).
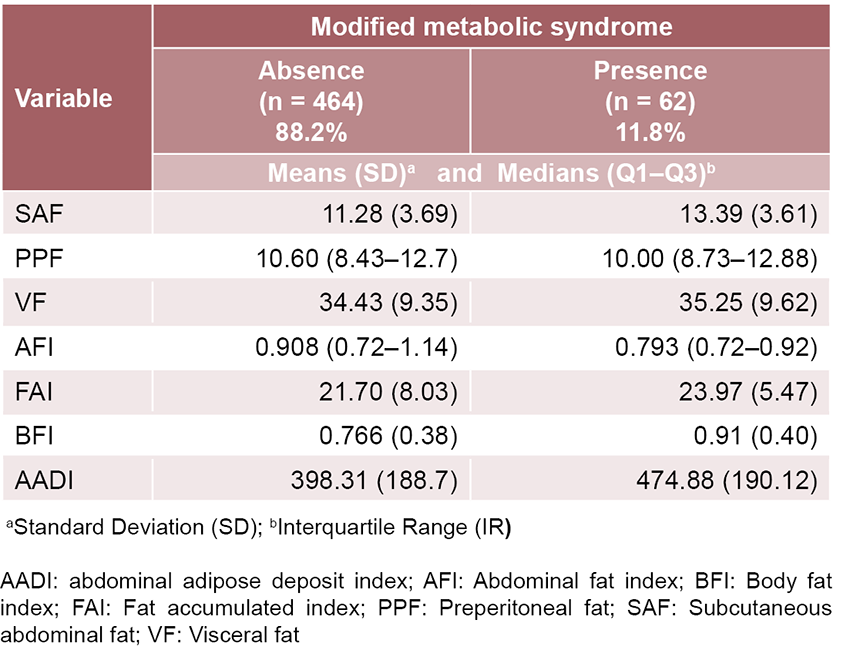
Table 2 shows the prevalence of MetS, as well as the descriptive statistics of the US variables in study participants.
When the Panel III criteria modified to identify MetS in pregnant women were applied as the gold standard, it was confirmed that 62 had MetS (11.8%), in whom a highly significant AADI increase was observed as an expression of increased abdominal adiposity (Table 2).
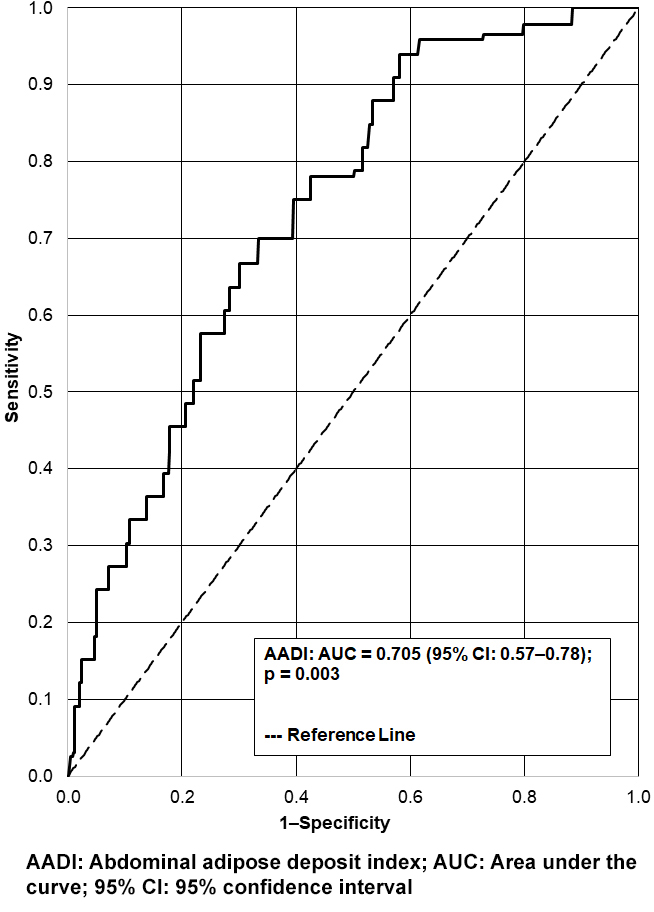
In the ROC curve (Figure 2) used to evaluate the discriminant ability of the AADI to detect MetS, the area under the curve was 0.705 (95% CI: 0.57‒0.78), with a standard error of 0.064 and p = 0.003.
AADI’s cutoff point was calculated at 350 mm<sup>2</sup>, for presence of MetS, identified at coordinates 0.457 and 0.781 on the x- and y-axes, respectively, corresponding to 78.1% of participants with correct diagnosis of MetS and 45.7% false positives.
Diagnostic test The contingency table (Table 3) shows the cross-classification between modified MetS based on NCEP-ATP III criteria and AADI with its cutoff point.[28]
DISCUSSION Prevalence of the MUONW phenotype in normal-weight pregnant women was 6.3%, coinciding with the highest AADI values among all women studied. These results show that some pregnant women, despite classification as normal weight, exhibit increased abdominal adiposity along with an underlying metabolic abnormality.[2] This phenomenon has been noted by other authors such as Ahmadi, who detected MetS in 5.3% of non-obese women in the first trimester of pregnancy based on US evaluation of visceral fat thickness.[20] Pinto Lima reported a 3.0% prevalence of MetS in early pregnancy according to Panel III criteria, also using anthropometric measures, blood pressure, metabolic profile, and US measurements of SAF and VF thickness.[6]
Table 2: Prevalence of modified metabolic syndrome and descriptive statistics of the ultrasound variables in normal weight pregnant women
Figure 2: ROC curve for the abdominal adipose deposit index (AADI) to identify metabolic syndrome (MetS) in normal-weight pregnant women studied
The different capacity of the SAF to store triglycerides and the uncontrolled and growing flow of free fatty acids to other tissues with ectopic fat deposit and lipotoxicity are evident in the MUONW phenotype. This demonstrates that such a fat layer is not an inert depot, but rather can contribute to the pathogenesis of IR with greater circulation of cytokines and free fatty acids, elevating risk of complications during pregnancy.[29]
Research on subcutaneous adipose deposits and IR in non-pregnant women emphasizes the superficial and deep compartments of the subcutaneous fat layer and describes two histologically unique tissues separated by a discrete fascial plane. The fact that the thickness of the deep subcutaneous tissue layer varies with obesity and has been shown to be a better predictor of IR than usual indicators would explain that in phenotypes classified as normal weight by their BMI, but which are actually obese due to their abdominal adipose tissue distribution, the layer of deep subcutaneous adipose tissue reveals a differentiation in metabolic behavior. This explains the characterization of the relative contribution of SAF and VF in dysmetabolism in pregnant women.[9] In the MUONW phenotype, the layer of subcutaneous adipose tissue is greater (while we were unable to discriminate between its superficial and deep layers, taking them into account together instead).
Increased subcutaneous adipose tissue would cause the visceral fat to increase its triglyceride accumulation function, causing a greater metabolic dysregulation, detectable by applying the proposed AADI.
AADI values in the different groups studied, characterized by notable differences between the phenotypes MHNW and MHONW, and between MHONW and MUONW, confirm the common characteristics that identify metabolically unhealthy obesity with MetS in the determination of the MUONW phenotype. This confirms what is posited in other studies that reveal an association of subcutaneous and visceral adipose tissue—not just general adiposity—with various cardiometabolic risk factors.[30]
These results confirm the benefit of applying AADI in early pregnancy for normal-weight women, even when clinical manifestations of MetS have not been identified, which would allow for timely guidance regarding healthy behaviors.
The sensitivity demonstrated by the AADI diagnostic test with a high number of pregnant women correctly diagnosed with MetS, as well as the discriminant ability of this index for the MUONW phenotype in normal-weight women in early pregnancy, allows for diagnosis of the hidden risk of cardiometabolic disease based on ultrasound evaluation of SAF and VF. This demonstrates the robustness of the new index, which can be used in primary health care to reliably diagnose metabolic disorders at the start of pregnancy, with a practical value from the clinical perspective.
The principal limitation of this study is that the distinctive features of abdominal adiposity distribution were not studied, nor was its relationship with cardiometabolic risk factors in pregnant women according to their reproductive status.
The ultrasound measurement of SAF and VF and its later expression in the AADI together with the routine exam for normal-weight women in the first trimester of pregnancy is simple, low cost and feasible, given the availability of US machines in primary health care in Cuba, as part of the nationwide Maternal-Child Care Program.
Unlike Panel III, here the direct measurement of abdominal fat is performed, which allows for reliable diagnosis of unhealthy obesity phenotypes like metabolically obese, normal-weight phenotype with increased risk of cardiovascular disease and MetS. In this way, complications may be avoided during pregnancy among women apparently at low obstetric risk.
CONCLUSIONS AADI is better than other traditional indicators at detecting the risk of metabolic obesity in early pregnancy in normal-weight women, facilitating early intervention in clinical practice to prevent or delay progression of cardiometabolic disease in these women.
Woldemariam MM, Evans KD, Butwin AN, Pargeon RL, Volz KR, Spees C. Measuring abdominal visceral fat thickness with sonography: a methodologic approach. J Diagn Med Sonogr. 2018 Jan 13;34(2):91–6. https://doi.org/10.1177%2F8756479317747210
Suárez-Carmona W, Sánchez-Oliver AJ, González-Jurado JA. Fisiopatología de la obesidad: perspectiva actual. Rev Chil Nutr. 2017;44(3):226–33. http://dx.doi.org/10.4067/S0717-75182017000300226. Spanish.
Costa Gil JE, Spinedi E. La tormentosa relación entre las grasas y el desarrollo de la diabetes mellitus de tipo 2: actualizado. Parte 1. Rev Argent Endocrinol Metab. 2017 Jul–Sep;54(3):109–23. Spanish.
Narankiewicz DP. Caracterización de los fenotipos metabólicamente discordantes de la población adulta de Málaga [thesis]. [Málaga]: Universidad de Málaga, Publicaciones y Divulgación Científica; 2014. 194 p. Spanish.
Pinto Lima MC, Oliveira Melo AS, Santos Sena AS, Oliveira Barros V, Ramos Amorim MM. Metabolic syndrome in pregnancy and postpartum: prevalence and associated factors. Rev Assoc Med Bras. 2019 Dec;65(12):1489–95. http://doi.org/10.1590/1806-9282.65.12.1489
Expert Panel on Detection, Evaluation, and Treatment of High Blood Cholesterol in Adults. Executive summary of the Third Report of the National Cholesterol Education Program (NCEP) expert panel on detection, evaluation, and treatment of high blood cholesterol in adults (Adult Treatment Panel III). JAMA. 2001 May 16;285(19):2486–97. https://doi.org/10.1001/jama.285.19.2486
Mejia-Montilla J, Reyna-Villasmil E. Obesidad, insulinorresistencia e hipertensión durante el embarazo. Rev Venez Endocrinol Metab. 2017 Oct;15(3):169–81. Spanish.
De-Souza LR, Kogan E, Berger H, Alves JG, Lebovic G, Retnakaran R, et al. Abdominal adiposity and insulin resistance in early pregnancy. J Obst Gynecol Canada. 2014 Nov;36(11):969–75. http://doi.org/10.1016/S1701-2163(15)30409-6
Catalano PM, Shankar K. Obesity and pregnancy: mechanisms of short term and long term adverse consequences for mother and child. BMJ. 2017 Feb 8;356:j1. https://doi.org/10.1136/bmj.j1
Hiremath R, Ibrahim J, Prasanthi K, Reddy HT, Shah RS, Haritha C. Comparative study of ultrasonographic and anthropometric measurements of regional adiposity in metabolic syndrome. J Clin Diagn Res. 2017 Aug;11(8):TC01. https://doi.org/10.7860/jcdr/2017/26386.10352
Saif Elnasr I, Ammar H. Ultrasound markers for prediction of gestational diabetes mellitus in early pregnancy in Egyptian women: observational study. J Matern Fetal Neonatal Med. 2021 Oct;34(19):3120–6. https://doi.org/10.1080/14767058.2019.1678132
Suzuki R, Watanabe S, Hirai Y, Akiyama K, Nishide T, Matsushima Y, et al. Abdominal wall fat index, estimated by ultrasonography, for assessment of the ratio of visceral fat to subcutaneous fat in the abdomen. Am J Med. 1993 Sep;95(3):309–14. https://doi.org/10.1016/0002-9343(93)90284-v
Straughen J, Trudeau S, Misra VK. Changes in adipose tissue distribution during pregnancy in overweight and obese compared with normal weight women. Nutr Diabetes. 2013 Aug 26;3(8):e84. https://doi.org/10.1038/nutd.2013.25
Nassr AA, Shazly SA, Trinidad MC, El-Nashar SA, Marroquin AM, Brost BC. Body fat index: a novel alternative to body mass index for prediction of gestational diabetes and hypertensive disorders in pregnancy. Eur J Obst Gynecol Reprod Biol. 2018 Sep;228:243–8. https://doi.org/10.1016/j.ejogrb.2018.07.001
Alkhalaqi A, Al-Naimi F, Qassmi R, Shi Z, Ganji V, Salih R, et al. Visceral adiposity index is a better predictor of type 2 diabetes than body mass index in Qatari population. Medicine (Baltimore). 2020 Aug 28;99(35):e21327. https://doi.org/10.1097/md.0000000000021327
Pineda H, Castro J, Lares M, Huérfano T, Brito S, Velasco M, et al. Lipid accumulation product (LAP) and visceral adiposity index (VAI) a simple and clinically useful surrogate marker for metabolic syndrome and cardiovascular disease predictor in non-diabetic Venezuelan adults. J Pharm Pharm Sci. 2017 Sep;2(2):1–8. http://dx.doi.org/10.24218/vjpps.2017.20
Du T, Yu X, Zhang J, Sun X. Lipid accumulation product and visceral adiposity index are effective markers for identifying the metabolically obese normal-weight phenotype. Acta Diabetol. 2015 Oct;52(5):855–63. https://doi.org/10.1007/s00592-015-0715-2
Madeira FB, Silva AA, Veloso HF, Goldani MZ, Kac G, Cardoso VC, et al. Normal weight obesity is associated with metabolic syndrome and insulin resistance in young adults from a middle-income country. PLoS One. 2013;8(3):e60673. https://doi.org/10.1371/journal.pone.0060673
Ahmadi F, Moukhah S, Hosseini R, Maghari A. Ultrasound evaluation of visceral fat thickness for prediction of metabolic syndrome in the first trimester of pregnancy in a sample of non-obese Iranian women. Oman Med J. 2019 Jul;34(4):308–12. https://doi.org/10.5001/omj.2019.61
Grieger JA, Grzeskowiak LE, Smithers LG, Bianco-Miotto T, Leemaqz SY, Andraweera P, et al. Metabolic syndrome and time to pregnancy: a retrospective study of nulliparous women. BJOG. 2019 Jun;126(7):852–62. https://doi.org/10.1111/1471-0528.15647
Armellini F, Zamboni M, Rigo L, Todesco T, Bergamo-Andreis IA, Procacci C, et al. The contribution of sonography to the measurement of intra-abdominal fat. J Clin Ultrasound. 1990 Sep;18(7):563–7.
Carmenate Milián L, Moncada Chévez FA, Leiva B, Waldermar E. Manual de Medidas Antropométricas. Programa Salud, Trabajo y Ambiente en América Central (SALTRA). Instituto Regional de Estudios en Sustancias Tóxicas. Heredia (CR): Universidad Nacional de Costa Rica; 2014. Spanish.
Pérez Caballero MD, León Álvarez JL, Dueñas Herrera A, Alfonzo Guerra JP, Navarro Despaigne DA, de la Noval García R, et al. Guía cubana de diagnóstico, evaluación y tratamiento de la hipertensión arterial. Rev Cubana Med. 2017;56(4):242–321. Spanish.
Padrón MP. Segundo Consenso Cubano de Diabetes y Embarazo. Rev Cubana Endocrinol. 2018;29(1):1–12. Spanish.
Wani K, Sabico S, Alnaami AM, Al-Musharaf S, Fouda MA, Turkestani IZ, et al. Early-pregnancy metabolic syndrome and subsequent incidence in gestational diabetes mellitus in Arab women. Front Endocrinol (Lausanne). 2020 Feb 27;11:98. https://doi.org/10.3389/fendo.2020.00098
de Mutsert R, Gast K, Widya R, de Koning E, Jazet I, Lamb H, et al. Associations of abdominal subcutaneous and visceral fat with insulin resistance and secretion differ between men and women: The Netherlands Epidemiology of Obesity Study. Metab Syndr Relat Disor. 2018 Feb;16(1):54–63. https://doi.org/10.1089/met.2017.0128
Rønn PF, Andersen GS, Lauritzen T, Christensen DL, Aadahl M, Carstensen B, et al. Abdominal visceral and subcutaneous adipose tissue and associations with cardiometabolic risk in Inuit, Africans and Europeans: a cross-sectional study. BMJ Open. 2020 Sep 14;10(9):e038071. https://doi.org/10.1136/bmjopen-2020-038071
THE AUTHORS
Alina Artiles-Santana (Corresponding author: alina.artiles68@gmail.com), family physician. Assistant professor, Prenatal Diagnostic Ultrasound Department, Chiqui Gómez Lubián Teaching Polyclinic, Santa Clara, Cuba. https://orcid.org/0000-0001-5908-936x
Nélida Liduvina Sarasa-Muñoz, physician specializing in human anatomy with a master’s degree in medical education and a doctorate in medical sciences. Full professor and senior researcher, Department of Basic Research, Medical University of Villa Clara (UCMVC), Santa Clara, Cuba. https://orcid.org/0000-0002-2353-5361
Eduardo Izaguirre-Castellanos, automatic control engineer with a master’s degree in automatic control and a doctorate in technical sciences, School of Electrical Engineering, Marta Abreu Central University of Las Villas, Santa Clara, Cuba. https://orcid.org/0000-0001-7911-784X
Elizabeth Álvarez Guerra-González, physician specializing in family medicine and biostatistics. Professor and assistant researcher, Biomedical Research Unit, UCMVC, Santa Clara, Cuba. https://orcid.org/0000-0003-2052-4058
Oscar Cañizares-Luna, physician specializing in human anatomy with a master’s degree in medical education and a doctorate in medical sciences. Full professor and senior researcher. UCMVC, Santa Clara, Cuba. https://orcid.org/0000-0001-9486-4675
No new Early Online articles at this time. The most recent articles are listed in the Current Issue Table of Contents. Early Online articles are added as soon as they are available, so please check back later.