INTRODUCTION
Chronic liver disease is an important health problem globally, with worldwide distribution independent of age, sex, region or race. Cirrhosis is the end result of a variety of liver diseases characterized by fibrosis and architectural distortion of the liver with formation of regenerative nodules. It has varying clinical manifestations and complications.
Globally, deaths from liver cirrhosis increased from about 676,000 in 1980 to more than 1,000,000 in 2010,[1] and by 10.3% between 2005 and 2015.[2] A systematic analysis from the 2015 Global Burden of Disease study estimated deaths from liver cancer and liver cirrhosis in four etiologic categories: hepatitis B virus (HBV) infection, hepatitis C virus (HCV) infection, alcohol and “other.” Viral hepatitis accounts for 53% of liver cirrhosis and 54% of liver cancers.
In Cuba, liver cirrhosis and other chronic liver diseases have been increasing. In 2016 they were the ninth cause of death, with a rate of 8.8 per 100,000 inhabitants, 3.6 times higher for men than for women.[3]
Fibrosis represents the histologically apparent final result of a liver healing response, to repair tissue damaged by chronic injury. The degree of fibrosis indicates the severity of liver disease. Different causes of chronic liver injury share similar fibrogenic mechanisms; the morphological pattern of fibrosis is related to the underlying disease because it reflects the topographic distribution of liver damage.[4]
The gold standard for diagnosing liver damage, including fibrosis, is liver biopsy. Histology is fundamental to assessment and management of patients with liver disease, and has long been considered an integral component of clinical diagnosis. However, it has little acceptance among patients because it is painful and invasive, and involves risk of complications such as bleeding and even death. Liver biopsy technique requires specific training to ensure collection of appropriately sized samples and the lowest possible complication rate. Sample variability is one of the main limitations of liver biopsy and it is not useful for performing periodic repeated followup assessments.[5–7]
Although histological findings are important for assessing prognosis and adapting treatment, noninvasive techniques may replace liver histology for these purposes, especially for assessing fibrosis severity. Measurement of liver stiffness (LS) using transient elastography has become one of the most feasible noninvasive methods for assessing liver fibrosis.[8,9]
Vibration-controlled transient elastography (VTE) is recommended for clinical management of liver disease patients. VTE with FibroScan (Echosens, France) offers several advantages over liver biopsy: it is relatively noninvasive, has fewer risks, covers larger areas of damaged tissue, is reproducible, has precision and accuracy comparable to those of liver biopsy, and results are instantly available. It can be repeated periodically and is substantially less expensive.[10] VTE can thus inform decisions regarding patient discharge after treatment for viral hepatitis.[9,10]
The FibroScan device measures shear wave velocity. In this technique, a 50 MHz wave passes through the liver from a small transducer at the end of an ultrasound probe. The probe also has an end transducer that can measure shear wave speed (in meters per second) as the sound wave passes through the liver. The technology measures sound wave speed and converts it into a measurement of LS in kilopascals (kPa). The entire process is commonly known as liver ultrasound elastography.[11]
LS is proportional to severity of hepatic fibrosis, with reference cutoff points corresponding to stage of hepatic fibrosis in patients with chronic liver disease. These reference values are specific to underlying liver disease and to a given population. Most research is based on Western populations. In both European and Asian studies, LS in healthy adults is in the range of 2.5–7.5 kPa, with an average of 5.5 kPa. Globally, no ideal LS cutoff values have yet been established for healthy individuals.[12–17]
FibroScan was introduced in Cuba in 2014, through a collaborative agreement with the Spanish Development Cooperation Agency. As a result, Cubans needing assessment of damage from hepatic disease were assured universal and equitable access to this cutting-edge technology. Characterizing local or regional reference LS values for healthy individuals would enable appropriate interpretation and comparison of LS results. Hence, the purpose of this study was to measure LS in Cuban adults without liver disease and study its association with age, serum uric acid and body mass index (BMI).
METHODS
A cross-sectional study was conducted at the Institute of Gastroenterology (IGE) in Havana between January 2016 and February 2017. Of 263 plasma donors admitted to the Havana Province Blood Bank during that period, 150 volunteered to participate in the study and gave written informed consent. Volunteers were excluded if screening tests routinely performed in the donor program indicated that they were infected with hepatitis B, hepatitis C, or HIV. Other exclusion criteria were pregnancy, more than occasional or social consumption of alcohol, use of potentially hepatotoxic drugs, cancer, ischemic liver diseases, obesity (BMI >30 kg/m2), use of pacemakers or other electronic devices and ascites. Of the 150 volunteers, 110 met inclusion criteria: age ≥19 years (range 19–75), chest circumference >75 cm and <110 cm, skin–liver capsule distance <2.5 cm.
Laboratory analyses followed principles of good clinical practice for clinical trials, which are externally quality controlled by the national regul atory authority, the Center for State Control of Medicines, Equipment and Medical Devices. Data on participants were obtained by an interviewer-administered questionnaire covering medical history, current status, and use of medications, alcohol or other potential toxins (herbs, drugs). All participants were assessed according to the FibroScan Use protocol of IGE’s Department of Hepatology.
Variables LS Measurement These were performed on the same day as blood extraction, after laboratory tests and abdominal ultrasound. An experienced technician, who did not know the participants’ clinical information, performed all LS measurements. The FibroScan operator placed the M probe (3.5 MHz frequency) in the right hepatic lobe (this localization allows in-depth assessment of hepatic parenchyma volume comparable to that of a cylinder 10 mm x 40 mm, 25–65 mm below the skin surface) through the intercostal spaces, with participants in dorsal decubitus with the right arm in maximal abduction: then the probe button was pressed to obtain the measurement,[18] expressed in kPa. Results were considered useful once 10 valid measurements were completed (computer generated), with a success rate of >60% and an interquartile range (IQR) over median variation of valid measurements with respect to their median value of <0.3.[19–21]
Demographics These were sex (male, female), age (in years, continuous and grouped by <50 and ≥50)
Physical measures These were weight (kg) and height (cm), body mass index (BMI) grouped as normal weight (18.5–24.9 kg/m2) and overweight: 25–29.9 kg/m2, thoracic perimeter (cm).
Abdominal ultrasound This was performed by two experienced radiologists, with very good interobserver agreement (kappa index >0.7) using Toshiba Aplio 300 Ultrasound (Toshiba Medical Systems Europe, The Netherlands). Skin capsule distance was calculated. Liver size, capsular contour, parenchymal echogenicity, vascularity, biliary tree and presence of masses or abscesses were also assessed.
Virology Confirmatory hepatitis serology was performed in IGE’s molecular biology laboratory by ELISA for hepatitis B virus surface antigen (HBsAg), hepatitis B virus core antibody (anti-HBc) and antibody to hepatitis C virus (HCVAb) using SUMA technology (Immunoassay Center, TecnoSuma Internacional, SA, Cuba). Reverse PCR for hepatitis B and hepatitis C viruses was performed using commercially available kits (Cobas Amplicor version 2.0 for hepatitis B and C virus; Roche Diagnostics, Germany). In addition, confirmatory HIV serology was performed by ELISA.
Laboratory tests Blood parameters were bilirubin, gamma-glutamyl transferase, alanine aminotransferase, aspartate aminotransferase, alkaline phosphatase, albumin, total proteins, glycemia, creatinine, triglycerides, amylase, total cholesterol, uric acid, urea and serum iron. These were measured in IGE’s clinical laboratory using routinely validated methods for the Cobas C311 clinical chemistry analyzer (Roche Diagnostics, Germany), with technical support from the manufacturer. Immunoglobulin G and M concentrations (reference values: IgG, 6.80–14 45 g/L; IgM, 0.14–0.91 g/L for men and 0.40–0.95 g/L for women) were determined by turbidimetry. Prothrombin time was measured (<15 seconds) using the ST4 Coagulation Analyzer (Diagnostica Stago, France), with technical support from the manufacturer.
Analyses Variables were recorded and processed in a database using SPSS Windows 21 (IBM-SPSS Inc., USA). Means, standard deviations, medians, ranges and frequencies were calculated. We also calculated the Pearson correlation coefficient for LS with BMI and laboratory tests. The 95% CI for the mean was calculated to obtain a reference range for LS.
Ethics Study participants gave written informed consent and patient confidentiality was assured. Those who did not meet all selection criteria were informed of the reasons for their exclusion and those with pathological conditions were referred for followup and control by IGE specialists. In such cases, the patients benefited from clinical and imaging tests to establish their diagnosis. The study was reviewed and approved by the IGE Research Ethics Committee. Diagnostic methods were selected based on maximum benefit, the ethical principle of doing no harm, established international and national guidelines, and resource availability.[22]
RESULTS
The 150 volunteers selected were negative for HBV, HCV and HIV infection. Forty were excluded for the following reasons: 2 had BMI >30 kg/m2, 15 had chest circumference <75 cm, 7 had fatty liver by abdominal ultrasound and 16 had abnormal laboratory tests (6 individuals with elevated transaminases, 2 with elevated gamma-glutamyltransferase, 1 with high bilirubin, 4 with hyperamylasemia and 3 with hypercholesterolemia and hypertriglyceridemia). The remaining 110 participants had a valid LS examination and were included in the final analysis. Patient flow is described in Figure 1.
Baseline characteristics Demographic data and laboratory values are summarized in Table 1. All participants had normal liver enzymes and hepatic parenchyma (by ultrasound), and were free of chronic medical conditions or significant alcohol consumption. All had normal BMI.
The results of the LS measurements regarding reliability standards are summarized in Table 2, which shows an average success rate higher than 95% and an IQR/median of <0.3, the normal threshold.
Table 1: Descriptive statistics of age, body mass index and laboratory variables, baseline values by sex

Table 2: Study-generated standardization criteria for liver elastography
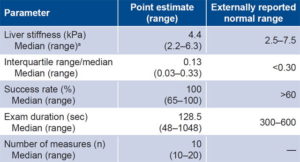
amean 4.4 kPa, 95% confidence interval 4.2–4.6 breferences 19–21
Figure 1: Flow of healthy plasma donors, Havana Province Blood Bank, 2016–2017
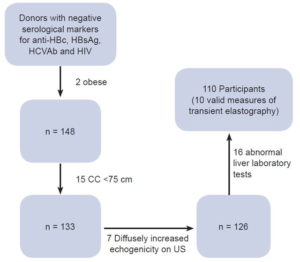
anti-HBc: antibody to hepatitis B core antigen | CC: chest circumference | HBsAg: hepatitis B surface antigen | HCVAb: hepatitis C antibodies | US: ultrasound
LS measurement by age, sex and BMI There was no correlation between age and LS measurements (r = -0.092, p = 0.338). The median (range) of LS measurements for subjects aged <50 years was 4.5 (2.4–6.1) and for subjects aged ≥50 years. 4.3 (2.2–6.3) kPa respectively (p = 0.102). Median LS was similar between women and men: 4.1 (2.4–6.1) and 4.5 (2.2–6.1) kPa, respectively (p = 0.086).
A positive correlation was found between LS and BMI (r = 0.255, p <0.01).
Correlation of LS measurements with laboratory parameters Among laboratory parameters, only serum uric acid had a positive and significant correlation with LS measurements (r = 0.266, p <0.01). Median uric acid in all participants was 298.6 μmol/L (range 155.2–428.0), 337.1 (155.2–428) for men and 242.4 (159.2–426.9) μmol/L for women. Overall uric acid levels in the study were normal. However, six women had a level of uric acid slightly above normal.
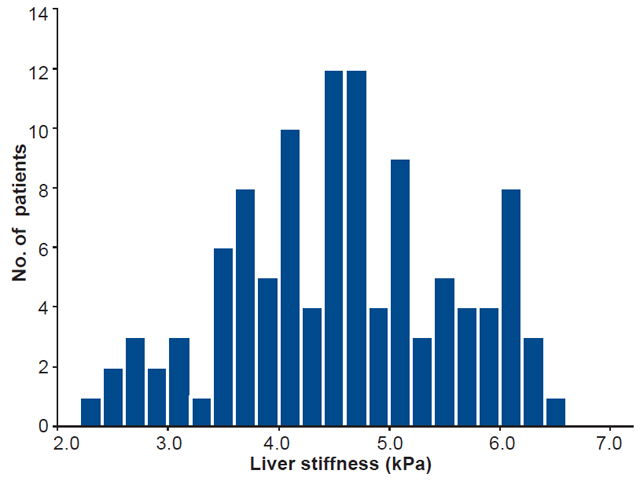
Reference range The LS reference range (95% CI) for the 110 subjects with no known liver disease was 4.2–4.6 kPa (mean 4.4) with distribution shown in Figure 2. The total range for this variable was 2.2–6.3 kPa.
DISCUSSION
LS is ethnically and anthropometrically diverse, and should be assessed in healthy subjects to obtain an appropriate reference range. Due to a lack of large population studies in healthy subjects, reference values for LS are not available. The present study was performed with participants with no apparent liver disease and is the first attempt to obtain approximate LS reference values in Cuban adults. These values should be compared to well-established cutoff points for various stages of fibrosis obtained in patients with specific liver disease. There is growing interest in estimating the elasticity of liver tissues because focal and diffuse diseases are often related to changes in tissue elasticity.[23,24]
Figure 2: Liver stiffness in healthy plasma donors, Havana Province Blood Bank, 2016–2017 (n = 110)
In the study, LS values were not significantly different between men and women, coinciding with what Kim[25] and Alsebaey describe.[26] However, they contrast with results from other authors, who report higher values in men than in women.[15,27–29] Female sex appears to be a protective factor in fibrosis progression in chronic liver diseases, because estrogens have a fibrosuppressive effect.[30,31] However, it is still unknown whether extracellular matrix density in the liver differs between healthy men and women.[28] Factors other than sex appear to be more influential, making sex-specific reference ranges of little use.
The groups aged <50 and ≥50 years had similar LS means, concistent with results obtained by Colombo,[16] Kumar[32] and Das.[17] However, Fung found lower LS values in healthy Chinese older adults.[27]
One important finding is that LS is significantly associated with BMI, which has been described as an independent predictor of LS. Hu explored LS in healthy Chinese adults using real-time tissue elastography and found it unaffected by age and sex but positively correlated with BMI.[33]
Das found that LS values were higher at the extremes of BMI distribution, i.e., in obese and underweight individuals.[17] Cellular components and the Glisson capsule are probably more important in explaining BMI’s effect on LS measurement in a healthy liver.[34,35] Geographic location and ethnicity influence nutritional status, which could indirectly help explain differences in results.
To date, research to identify ideal cutoff values in healthy individuals shows variable results, due to diverse methods used, as well as geographic and social environments. These differences reveal the influence of context on LS, and therefore the need to identify national or regional reference values according to the different environmental factors, and the habits and lifestyles of each region.
A prospective study in Gambia assessed the impact of food intake on LS measurement values in subjects with chronic hepatitis B and healthy controls. The results suggested that food intake (an 850 Kcal breakfast) significantly increased LS (and IQR), compared to fasting values.[36] Other factors may also increase LS, such as liver infiltration with tumor cells, mastocytosis, inflammatory cells (all forms of hepatitis), and amyloidosis. In addition, LS correlates directly with venous pressure and increases during mechanical cholestasis. Therefore, LS should always be interpreted in the context of clinical and laboratory findings and imaging studies.[37]
One of the most important findings of this study was the influence of uric acid on LS. This is an inert metabolic end product of purine metabolism, which has recently been assigned a causal role in hypertension, metabolic syndrome, diabetes, nonalcoholic fatty liver disease and chronic kidney disease.[38] The purine group varies significantly with dietary animal protein content and with final metabolism of endogenous purines derived from liver, intestines and other tissues such as muscles, kidneys and vascular endothelium.[39]
Normal values of serum uric acid in the general population are controversial; evidence suggests that silent deposition of monosodium urate crystals as a result of hyperuricemia can lead to early destructive skeletal changes. Moreover, this may play a pathophysiological role in many cardiovascular, renal and metabolic disorders. Desideri recommended carefully reconsidering the concept of “asymptomatic” hyperuricemia.[40] In view of new scientific knowledge about the pathophysiological role of uric acid in human disease, a threshold value of <6.0 mg/dL (<360 μmol/L) seems to better identify truely healthy subjects and should be reasonably considered for all individuals.
Hyperuricemia is a common symptom of metabolic syndrome, together with hypertriglyceridemia and abnormal accumulation of liver fat, either as simple steatosis (nonalcoholic fatty liver) or nonalcoholic steatohepatitis, which is usually accompanied by fibrosis with subsequent progression to cirrhosis.[41]
Our findings suggest that LS is influenced by uric acid levels, something only detectable by transient elastography, even before changes in parenchymal echogenicity are observed in abdominal ultrasound. Further research is needed to clarify the effects of uric acid on liver elasticity in healthy people.
One study limitation is that our sample was relatively small and perhaps not representative of the Cuban population, which suggests cautious use of results. To address the difficulty of finding healthy adults to define LS cutoff values, we selected plasma donors because they are routinely screened for viral hepatitis, HIV, and other chronic diseases. A second study limitation is the lack of liver biopsies to confirm absence of fibrosis in participants.
This is the first Cuban study using FibroScan to measuring LS (there is no other such device in the country), and its results will enable better assessment of liver disease in clinical practice.
CONCLUSIONS
LS in Cuban adults without liver disease ranges from 2.2–6.3 kPa. The normal reference range is 4.2–4.6 kPa. Body mass index and serum uric acid levels are positively associated with LS; there is no association with sex and age.