INTRODUCTION
Cuba is one of the few countries attaining a high world ranking in volleyball, its men’s and women’s teams winning first place concurrently in global competition over a number of years.[1] Besides Cuba, only the former Soviet Union, Brazil, the United States and Russia have had concurrent Olympic winners in teams of both sexes.[2]
During the 1990s, the International Volleyball Federation (FIVB, the French acronym) awarded the Paul Libaud Cup to Cuba three times for best overall results in both men’s and women’s volleyball[1] and selected Cuba’s Regla Torres as best female player and Eugenio George as best women’s team coach of the 20th century.[2] Cuba won an unprecedented —and still unmatched—three consecutive Olympic gold medals in women’s volleyball (Barcelona,1992; Atlanta, 1996; Sydney, 2000) and a new generation of players followed that feat up with bronze in Athens in 2004.[1,2]
Athletes’ kinanthropometric profiles, broadly treated in the international scientific literature,[3–5] comprise: the body’s chemical and/or structural composition; somatotype, describing endomorphy (relative adiposity), mesomorphy (relative musculoskeletal development) and ectomorphy (relative linearity or slenderness); and proportionality, defined as the relations among the different anthropometric dimensions.[6]
In existing scientific sports literature, proportionality has been addressed using a mathematical model known as the phantom stratagem,[7–9] introduced by Ross and Wilson in the 1970s to compare differences in proportion of both body shape and size. Individuals are compared according to a theoretical reference model that is conceptually unisex and bilaterally symmetrical, without regard to ethnic or age differences. Deviations obtained for each of the anthropometric dimensions compared are called phantom Z-scores.[10]
Knowledge of a successful athlete’s physical structure is a necessary point of departure for talent selection, the basis for the phenomenon known as morphological optimization, which aims to achieve optimal physical structure, body composition and somatotype for most efficient athletic performance in any sport.[11–13] Morphological optimization is a gradual process, the evolution of which has been described for many sports, including volleyball.[14]
In sports such as volleyball, kinanthropometric assessment is particularly important, as study of absolute size is an important element for analysis of athletic success. Several authors have shown that volleyball players possess muscular power, jumping prowess, strength and height in blocking, strength and speed for spiking, endurance, speed and agility, among other kinanthropometric characteristics.[15–20]
Several studies on volleyball players at different performance levels have shown that the kinanthropometric profile of female players presents greater absolute size in comparison with those of other sports[14,17] and an average somatotype within the central,[17,21,22] balanced mesomorphic,[23] mesoendomorphic[21,24] and balanced ectomorphic categories.[21]
Kinanthropometric attributes of volleyball players correlate with the sport’s technical-tactical demands,[17,25–28] as in other team sports such as basketball,[29–31] handball,[25] rugby[32,33] and baseball.[34,35] Studies of volleyball support this last assertion: Olympic winning teams present higher indices of physical performance and height than their competitors.[36] Huang et al. proposed that part of the secret of the Cuban women’s volleyball team’s competitive success in the 1990s was their stellar physical capacity and power.[37,38]
The specialized literature presents data addressing aspects of the Cuban women’s volleyball team’s competitive success during the 1990s.[36–38] However, there is a dearth of more detailed reports that would serve as points of departure for future analysis. The objective of this study was to describe the kinanthropometric profile of Cuban women Olympic volleyball champions from 1992 through 2000, according to positions and roles played.
METHODS
Study type and universe An analytic descriptive study was conducted to develop the kinanthropometric profile of the Cuban women’s volleyball team participating in the Olympic cycles in Barcelona (1992), Atlanta (1996), and Sydney (2000). The 41 athletes composing the study universe included 98% of Olympic champions in the three summer events who played in the following positions: 9 centers, 8 setters and 24 spikers. Mean participant age was 22.2±3.9 years; mean athletic experience was 10.1±4.1 years.
Inclusion criterion Athletes who participated as a member of the national team in at least one FIVB official competition during the Olympic cycle in which they were active athletes.
Ethical considerations All athletes participating in the study provided written informed consent for data publication as a contribution to quality improvement in medical supervision of training, talent selection, and teaching of applied sciences in sports. The study was approved by the ethics committee of Cuba’s Sports Medicine Institute.
Compilation of data and equipment Primary information source was the Cuban Volleyball Anthropological Project (PAVC, the Spanish acronym) database, available through the Sports Medicine Institute’s kinanthropometry department.
In the study, 23 anthropometric indicators were analyzed (body weight, height and sitting height, 6 breadths, 8 circumferences and 6 adipose skinfolds), based on the recommendations established by Lohman et al.[39] Indirect indicators of body composition, somatotype and proportionality were derived from these measurements as described below.
Measurements entered in the database were made by qualified anthropometrists with over 20 years experience. Equipment used included a scale accurate to 0.1 kg (Detecto, USA); stadiometer accurate to 0.1 mm (Holtain, UK); skinfold caliper (10 g/mm2) accurate to 0.1 mm (Holtain, UK); anthropometer and sliding compass accurate to 1 mm (Holtain, UK) to determine bone diameters; and a metric tape accurate to 1 mm (Holtain, UK) for linear measurements.
Body composition Body composition was determined by the Ross and Kerr anthropomorphic fractionation protocol.[40] Fractions of adipose, muscle, skeletal, residual and skin tissue mass were obtained based on the 23 anthropometric dimensions measured. Absolute (kg) and relative (%) values were calculated for all tissues, the latter as [estimated tissue mass (kg) x 100]/body mass. The difference between body mass obtained by scale and that predicted by the Ross and Kerr method was expressed in absolute (kg) and relative terms (%) and defined as Error: [mass obtained by scale − estimated mass per Ross and Kerr method] x 100/mass obtained by scale.
Heath and Carter anthropometric somatotype and Somatotype Attitudinal Mean (SAM) The Heath–Carter anthropomorphic somatotype method [41] was used to define body shape and composition in terms of endomorphy, mesomorphy and ectomorphy. Quantitative values derived were categorized on a scale defining values of 0 to 2.5 as low, 3 to 5 as moderate, 5.5 to 7 as high, and above 7 as very high.[41] The greater value of one component over another served to define somatotype categories in each playing position; values differing by less than 0.5 were considered insignificant and positions differing by that amount were deemed equivalent.
SAM was determined using as a reference the average somatotype obtained for all female volleyball players in the study (n = 41), following the procedure established by Duquet and Hebbelinck,[42] in which deviation of each individual somatotype with respect to mean group somatotype is determined and the sum of individual deviations divided by the number of individuals in that playing position. Magnitude of somatotype deviation of each position from that of the total volleyball player population (n = 41) was presented in a box and whisker graph.
With the average somatotype of each playing position, an x:y somatopoint was computed derived from the values for each component. Next, the somatopoint was placed in the somatochart, a diagram divided into 13 zones illustrating the distribution of each somatotype category with respect to relative dominance of one component over the others. Somatotype classification for each playing position can be identified from the location of the somatopoint in this structure. The methodology used for this procedure was described by Heath and Carter.[22]
Body proportionality and anthropometric indicators As a measure of body proportionality, phantom Z-scores were obtained for adipose, muscle, skeletal and residual tissue masses.[43] Indices calculated were Body Mass Index, BMI (kg/m2), muscle-to-bone ratio (in kg) and the sum of six adipose skinfold thicknesses (Σ6 skinfolds).
Data analysis PAVC data were compiled in an Excel spreadsheet and calculations made to determine body composition, somatotype, proportionality and indices.
Mean and standard deviation (SD) were calculated for the following variables of absolute size: body weight (kg); standing and sitting heights (cm); breadths (cm): biacromial, bi-iliocrestal, anteroposterior thorax, transverse thorax, humerus and femur; circumferences (cm): head, extended arm, flexed arm, forearm, thorax, waist, thigh, calf; and skinfolds (mm): triceps, subscapular, supraespinal, abdominal, front thigh and medial calf. Mean and SD were also calculated for adipose, muscular, skeletal, residual and skin tissue masses; percentages and phantom Z-scores for adipose, muscular, skeletal and skin mass; endomorphy, mesomorphy, ectomorphy, and the Σ6 skinfold and body mass indices; and estimate error for body weight and muscle-to-bone ratio.
Stepwise discriminant analysis was performed to establish the discriminatory power of functions of players’ physical structure and distinguish to what point the absolute dimensions employed discriminated between playing positions (spiker, setter and center). A territorial map was used to display differences among playing positions, locating group centroids and players in the graphic according to the discriminant function value. The results of this analysis were expanded to include classification percentages for each playing position.
Analysis of variance (ANOVA) was used to test equality of means between the three playing positions for: body mass, height, adipose mass, muscular mass, skeletal mass, BMI and muscle-to-bone ratio (kg). Tukey’s post-hoc test was used to quantify significant differences between playing positions for each variable.
The significance level set for the contrasts was p<0.05 and the package used for data processing was SPSS 19.0. The STATISTICA 8.0 program was used to design the figure showing SAM descriptive statistics.
RESULTS
Anthropometric attributes by playing position Centers generally had greater absolute size, due to greater mean weight, height, sitting height, breadths, and circumferences of contracted arm, relaxed arm, forearm, thorax and calf. They also presented higher mean values in subscapular, front thigh and calf skinfolds (Table 1).
Stepwise discriminant function analysis obtained two significant functions. Based on Wilk’s lambda (λ = 0.260, F = 11.19, p < 0.000), discriminant function one (DF1) contributed 86.3% of variance, while discriminant function two (DF2) contributed the remaining 13.7%. Of 23 variables used (Table 1), only height, sitting height and calf circumference contributed significantly to discrimination between playing positions.
Discriminant analysis found 87.8% of players (36 of 41) correctly classified by playing position: centers were 100% correctly classified by position, spikers 83.3% and setters 77.7%. Setters and spikers were more heterogenous, with individuals classified in various different playing positions.
There was disparity in DF1 between centers (centroid value 2.054) and setters (centroid value −1.812). The variables responsible were height (standardized coefficient 1.496) and sitting height (standardized coefficient −0.981), which both contributed significantly more to DF1 than did calf circumference (coefficient 0.359). For discriminant DF2, calf circumference (standardized coefficient 0.922) was responsible for the disparity between setters and spikers, who presented more extreme mean values of −0.786 and 0.430, respectively. Centers’ centroid was −0.504, with standardized coefficient of 0.026 for height and 0.200 for sitting height in DF2.
Table 1: Descriptive anthropometry of Cuban women Olympic volleyball champions by playing position
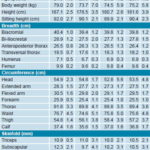
X: Mean SD: Standard deviation / Source: Cuban Volleyball Anthropological Project
In Figure 1, the multivariate spatial distribution of anthropometric features expands on previously presented information. Notably, there is well-defined separation of centroids between centers and players in the other two positions vis-á-vis the horizontal axis (DF1). Centroid values for setters and spikers further diverge when the vertical axis (DF2) is the basis of analysis.
Body composition and somatotype Centers had greater absolute and relative adipose tissue mass; setters had proportionately less adipose tissue than players in other positions with a Z-score of −1.7. Spikers presented the greatest relative muscular tissue mass, but setters had higher proportional muscular mass (Z = 0.9) compared to other positions. Spikers showed greatest skeletal mass (Z = −1.2) (Table 2).
The average somatotype of all players in the study was balanced mesomorphic (2.7–3.6–2.9) with moderate values for all components. Centers (2.9–3.4–3.4) showed an average mesomorphic–ectomorphic somatotype with moderate mean values for endomorphy, mesomorphy and ectomorphy. Setters (2.6–3.7–2.6) and spikers (2.8–3.6–2.9) presented a balanced mesomorphic somatotype, with moderate mesomorphy in both cases (Table 2).
Spikers presented a lower mean BMI, consistent with higher mean muscle-to-bone ratio (Table 2).
The somatotype chart (Figure 2) shows the location of the somatopoints of the mean somatotype for each playing position. As can be observed, all positions are located around the somatochart’s central zone, which coincides with the distribution of individuals presenting a similar value for all three somatotype components. Center players were found closest to the center—which coincides with absolute zero of the somatochart—followed by spikers.
Figure 1: Territorial map of Cuban women Olympic volleyball champions by playing position
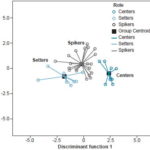
The dark box connecting the lines indicates the group centroid for each playing position. Horizontal and vertical axes show individual discriminant scores within discriminant functions 1 (horizontal axis) and 2 (vertical axis), which in turn reflect centroid distance for the respective analytic axis.
Source: Cuban Volleyball Anthropological Project
Figure 2: Somatotype distribution in Cuban women Olympic volleyball champions by playing position
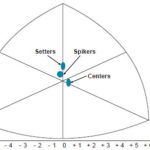
The dark circle represents the average somatotype of the position indicated by the arrow. / Source: Cuban Volleyball Anthropological Project
Figure 3 illustrates SAM’s descriptive characteristics. It is noteworthy that centers presented less variation in SAM than players in other positions and that centers’ and spikers’ SAM values were less than those of setters. Wider dispersion was found for setters and spikers, represented in the figure by larger boxes. The widest range (between maximum and minimum values) was observed in spikers and setters, in that order.
Table 2: Body composition, somatotype and anthropometric indices of Cuban women Olympic volleyball champions
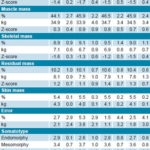
X: Mean SD: Standard deviation / Source: Cuban Volleyball Anthropological Project
Table 3: Body composition comparison by playing position of Cuban women Olympic volleyball champions
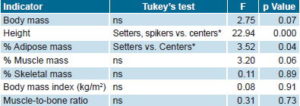
* p<0.05 / ns: no significant difference / Source: Cuban Volleyball Anthropological Project
Figure 3: Somatotype attitudinal mean in Cuban women Olympic volleyball champions by playing position
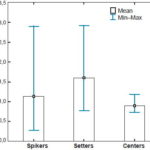
Source: Cuban Volleyball Anthropological Project
Position comparisons ANOVA found only height and percent adipose tissue significant in disproving the hypothesis of equality of means between athletes playing in different positions (Table 3). The remaining variables indicated equilibrium of means between positions for body mass, muscle tissue mass, bone mass and indices. Tukey’s post-hoc test showed that centers were significantly taller than players in other positions and adipose tissue mass was significantly greater in centers than in setters.
DISCUSSION
Carter has proposed that athletic success is multifactorial and that kinanthropometric attributes are not the only definitive factors in athletic performance.[6] Despite this, in a sport such as volleyball, several elements in the kinanthropometric profile such as height, arm length, leg length and sitting height all can influence competitive success, since they play a fundamental role in jumping, spiking and blocking.[17] To be successful, Cuban female volleyball players in the period 1992–2000 had to adapt to the competitive demands of the times, offsetting with technical and tactical elements and physical preparation the better defensive record of some elite teams, such as China and Brazil,[36–39] and the greater average height of players from countries with similar competitive levels, such as China (184.7 cm) and Russia (188.3 cm).[44,45]
The ability of Cuban female volleyball players of that generation to jump higher for spiking and blocking than other elite teams, as well as their greater offensive power[36–38] presumably were factors that compensated for their height disadvantages and favored their adaptation to the competitive level of the other teams.
We consider another definitive factor in their athletic success was their kinanthropometric profile, which is the result of sound selection of athletic talent, appropriate physical preparation and a well-balanced diet.
In specialized volleyball journals, height and body weight are the indicators most used to describe players’ absolute size. Differences reported between mean height and weight of players in Latin America (69.4 kg, 183.1 cm), Europe (72.6 kg, 184.9 cm), Asia (70 kg, 180.9 cm) and United States (74.6 kg, 183.9 cm),[45] may be a product of population genetic–environmental differences. In this study, the Cuban players (181.6±3.9 cm) were on average not among the tallest in the world, but more similar to players from dominant countries at similar competitive level, such as Brazil (182.0±6.7 cm) and Italy (181.9±7.3 cm).[45] Average body weight in this study coincides with the range reported in the sports medicine and related literature for elite female volleyball players, at 70 to 74 kg.[17–19,22–25,44,45]
Discriminant analysis found similarity across playing positions in these elite athletes’ physical structure, differentiated only by the requirements for height and sitting height within each position and by calf circumference.
Similarly, Carter et al. conducted a study in 1994 on players in the Women’s World Basketball Championship; discriminant analysis results were similar and classification percentage was close to 70%.[46] Height was also introduced in the stepwise discriminant analysis, which appears to be a constant in studies on team sports, as this variable plays a fundamental role in discrimination between positions with different biomechanical demands.
Differences found between players in different playing positions are related to the technical and tactical demands of each. A study by Gualdi-Russo and Zaccagni[17] showed that centers’ taller stature is definitive in blocking actions, while setters need to be more agile and quick, height being less important. In this study, centers presented a more homogeneous SAM, while setters and spikers showed more heterogeneity. This difference is related to the degree of specialization that centers have attained, and is consistent with descriptions by other authors concluding that certain positions in team sports are more homogeneous than others.[14,17,44,46]
The average somatotype found in this study (2.7–3.6–2.9) was predominantly mesomorphic with equilibrium between endomorphic and ectomorphic components. Carter[22] and Gualdi-Russo and Zaccagni[17] obtained a mean somatotype with similar magnitudes of the three components (central somatotype) for volleyball players on the US team (3.1–3.4–3.2) and for Italian first-division volleyball players (3.0–3.3–2.9), respectively. Vivolo et al.[24] obtained a somatotype in which endomorphy and mesomorphy were equally dominant in volleyball players in the Japanese team (3.4–3.7–2.9). Malousaris et al.[47] determined Greek first-division volleyball players (3.4–2.7–2.9) had a mean somatotype that was predominantly endomorphic, with an equilibrium between mesomorphy and ectomorphy. Cuban female players presented a lower average endomorphic value—i.e. were leaner—than all other female volleyball players in high level competition. The Cubans’ average mesomorphic value (relative musculoskeletal development) was greater than those of players from the United States,[22] Italy[17] and Greece.[47]
Values for percent adipose, muscular, skeletal and skin mass found for female first-division Argentinean players[48] were less than those observed in this study. Cubans’ lower percent adiposity (26.9%) and greater muscular mass (45.9%) compared to the Argentineans (38% and 38.5%, respectively) suggest that, despite their elite level, the Argentineans face a limiting factor in competing with the Cubans. Fat is known to be a liability for the development of certain potentialities, such as explosive power,[17,48,49] while lesser muscular mass limits strength development.[50] Cuban female players also showed a higher muscle-to-bone ratio than their Argentinean counterparts (5.0 vs. 3.8), translating into greater potential for offensive performance.
Analyzing data on women Olympic volleyball champions is a novel application of this type of kinanthropometric study, but the most innovative aspect is the introduction of the five-way fractionation method (compartmentalizing body mass into adipose, muscle, skeletal, skin and residual tissue). The body composition standards applied here, based on the Ross and Kerr anthropometric method,[40] can be used as a reference point by researchers and sports medicine specialists, since the literature consulted appears to have few references to the use of this fractionation method to estimate body composition of elite volleyball players. Application of this method opens possibilities for researchers concentrating on classification of female team sports players, since to date, studies of female athletes have been limited to the two-part fractionation method to categorize body mass.[14,18,19,25]
Our results are largely consistent with those in the international literature.[17–19,22–25,49] The fact that the study was conducted with data on Olympic champions can assist other authors in evaluating soundness of selection strategies for athletic talent, since anthropometric standards of Olympic and world champions are the yardstick by which professors, researchers and trainers design strategies to improve talent identification and to strengthen teaching of applied sciences in sports.
The lack of published research in areas associated with applied sciences in women’s volleyball has been offset with many studies in the area of traumatology and neuromuscular physiology.[27,28,50,51] Given the paucity of studies on Olympic champion volleyball players, and considering the Cuban women’s volleyball team’s record of achievement between 1992 and 2000, the current study provides multiple anthropometric references to serve as a starting point for new studies on the subject.
A limiting factor in our study was that it does not include reference values for female players performing in the opposite position. Literature on this position[17,47] is extremely rare, and the Cuban school of volleyball has not developed this playing position enough to have a representative sample included in the study, since its game system has for the most part been based on centers, setters and spikers, with a few liberos.[16]
Another possible limiting factor is the fact that the population of volleyball players under study is from 11 years ago. However, the majority of anthropometric values found are still valid in the Cuban volleyball population, although increased height has been noted.[15]
CONCLUSIONS
Cuba’s women Olympic volleyball champions present a kinanthropometric profile defined by significant musculoskeletal development and a predominantly mesomorphic somatotype with low endomorphy. Athletes’ height and body composition differ by playing position. Given the record of achievement of Cuba’s female volleyball team and the dearth of studies on Olympic volleyball champions, this study contributes knowledge useful for athletic talent selection, medical supervision of athletic training and teaching of applied sciences in sports.
ACKNOWLEDGMENTS
The authors wish to thank professors Lindsay Carter, Timothy Olds and Francis Holway for their collaboration in providing reference materials to enrich the analysis in this article.


