ABSTRACT
INTRODUCTION EKG remains a highly valuable tool for heart disease management. Corrected QT interval dispersion is a useful EKG parameter to assess prognosis in ischemic heart disease and specifically acute coronary syndrome. Understanding QT interval physiopathology helps assess importance of QT measurement in this context. Although increased QT dispersion is an ominous prognostic marker, its utility has not been evaluated for all types of acute coronary syndrome, even though in many circumstances it is the only tool available for diagnosing patients with equivocal EKG signs and/or atypical symptoms.
OBJECTIVE Describe corrected QT interval dispersion in acute coronary syndrome in three groups of patients—with ST elevation, without ST elevation, and without ST elevation with equivocal EKG signs—admitted to the intensive care unit of Celestino Hernández Robau University Hospital in Santa Clara, Cuba, from January 2010 through June 2011.
METHODS A descriptive retrospective study was conducted in 194 patients admitted with diagnosis of acute coronary syndrome. QT interval was measured and its dispersion calculated for the first EKG after symptom onset. Patterns were assessed for typical and atypical clinical presentations, and unequivocal and equivocal EKG signs.
RESULTS Nonclassifiable acute coronary syndrome was found in 6.7% of patients (13/194), the majority of whom had increased QT dispersion (76.9%, 10/13). There were significant differences in QT dispersion patterns between patients with typical and atypical presentations and between patients with equivocal and unequivocal EKG findings. In non-ST elevation acute coronary syndrome and nonclassifiable acute coronary syndrome with increased dispersion, atypical presentation was the most common (65.5%, 19/29; and 90%, 9/10, respectively).
CONCLUSIONS Corrected QT interval dispersion is a useful diagnostic tool for acute coronary syndrome, especially when patients present with atypical symptoms and equivocal EKG findings. Thus, it is a low-cost alternative in management of acute coronary syndrome in resource-poor settings.
KEYWORDS Risk factors, ischemic heart disease, acute coronary syndrome, myocardial ischemia, electrocardiography, QT interval dispersion, prognosis, Cuba
INTRODUCTION
Prolonged QT interval on EKG in coronary ischemia is a well-known sign to consider in estimating ischemic risk in acute coronary syndrome (ACS).[1,2] Prolonged QT interval, following Q-wave acute myocardial infarction, is associated with a significantly higher risk of sudden death.[3] It is a risk marker for ventricular arrhythmias at the time of the acute ischemic event, and some authors consider it also a predictor of longer-term ischemic risk in these patients.[4,5]
In addition to electrotonic uncoupling of the heart’s three tissue layers, resulting in greater heterogeneity in action potential duration, other mechanisms have been found that may be responsible for QT prolongation in acute ischemic heart disease. These include phospholipid catabolism abnormalities that disrupt sodium ion kinetics, as well as acidosis and local temperature changes in the epicardium.[6–17] Other studies show prolonged QT interval to be an independent predictor of risk in the study population when correlating heart-rate corrected QT (QTc) interval values with troponin levels in non-ST-elevation (NSTE) ACS.[18] Rodríguez described more ventricular arrhythmias during the acute coronary ischemic event and a new coronary ischemic event in followup of patients with increased QT interval dispersion.[19]
Repolarization dispersion, represented by the QT interval, is becoming increasingly valuable in detecting ischemia. A study comparing QT interval dispersion and ST-T segment changes found that the former correlated more strongly with results of radionuclide studies. This is explained by the many factors involved in ST segment abnormalities, such as tissue conductivity, fiber orientation and transmural extent of ischemia. It is possible that changes in repolarization duration (shortening action potential duration) caused by epicardial ischemia produce a repolarization gradient that can be measured more directly—and earlier—than ST abnormalities, detection of which requires a specific orientation by the ischemia-produced vector.[20]
ACSs are classified into ST-elevation ACS (STE-ACS) and non-ST-elevation ACS (NSTE-ACS); the latter include NSTE acute myocardial infarction and unstable angina. EKGs may show ST-segment depression, T-wave inversion, no changes or nonspecific (or equivocal) changes. In this paper, we call this last group of patients NSTE-ACS with equivocal EKG.[21]
Further study of EKG variables is important, since these can provide a complementary tool to assist diagnosis of ischemic heart disease, particularly in countries where health services cannot afford advanced diagnostics such as enzyme biomarkers. However, our literature review found no studies describing QT interval dispersion for NSTE-ACS, STE-ACS, and ACS with atypical symptoms and equivocal EKG changes in the same population. Thus, our objective was to describe the diagnostic significance of QT interval dispersion in the different types of ACS.
METHODS
Design and population A descriptive retrospective study was conducted based on chart review. The study universe comprised 237 patients admitted to the intensive care unit (ICU) of Celestino Hernández Robau University Hospital, Santa Clara, Villa Clara Province, Cuba, diagnosed with ACS, from January 2010 to June 2011. Patients were excluded who:
- were admitted to ICU with another diagnosis and developed ACS during their stay;
- had serum potassium ≤3.5 mEq/mL;
- were on antiarrhythmic drugs that modify QT interval;
- had rhythm or conduction disorders, such as Wolff-Parkinson-White Syndrome, complete atrioventricular block, pacemaker rhythm, atrial fibrillation, atrial flutter, or frequent ventricular or atrial extrasystoles prior to ACS;
- had previous channelopathies (long QT syndrome, short QT syndrome, Brugada syndrome);
- had EKG deficiencies (e.g., fewer than seven leads useful for measurement, poor tracing); or
- died from a noncardiovascular cause.
Clinical records were reviewed for the 194 patients who constituted the study sample, based on the above criteria.
EKG and QT interval measurement The first EKG following onset of ACS symptoms was obtained from the medical chart. QT interval was measured manually from onset of the QRS complex to the end of the T wave, defined as the point of return of the T wave to the isoelectric line, or the nadir between the T wave and U wave when the latter was present. Bazzet’s formula was used to calculate QTc.[22] In practice, QTc interval dispersion can be defined as the difference between maximum and minimum QTc intervals determined by standard 12-lead EKG. A QTc interval dispersion of <50 ms was considered normal and ≥50 ms increased.[23]
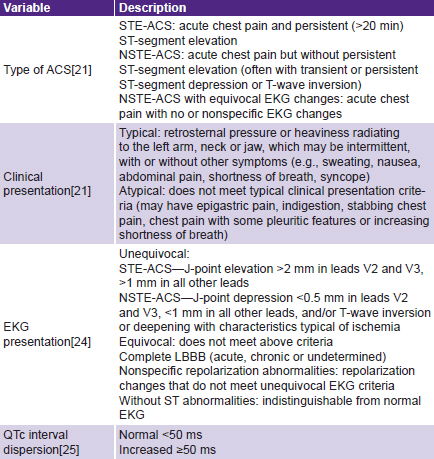
Variables are described in Table 1.
Table 1: Study variables

ACS: acute coronary syndrome / LBBB: left bundle branch block / NSTE: non-ST elevation / QTc: corrected QT interval / STE: ST elevation
Ethical aspects The study was approved by the Celestino Hernández Robau University Hospital scientific council. Analytical procedures ensured patient anonymity, consistent with the Helsinki Declaration and subsequent revisions.[26]
Statistical analysis Data were analyzed using SPSS 17.0 for Windows. All variables were described with absolute numbers and percentages. The chi-square test was used to assess associations among variables; the Fisher exact test was used when over 20% of expected frequencies were <5. The significance threshold was set at p <0.05.
RESULTS
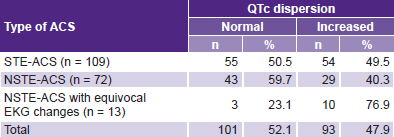
Increased QTc dispersion was observed in 47.9% of participants, the distribution of ACS type was significantly different between patients with and without increased QTc dispersion (p = 0.045). Increased QTc dispersion was most frequent in NSTE-ACS patients with equivocal EKG changes: 10/13, or 76.9%, vs. less than half in the other two groups (Table 2).
Table 3 shows that most patients with normal QTc dispersion had a typical clinical presentation (p = 0.007). Atypical presentation predominated only in patients with NSTE-ACS with equivocal EKG changes.
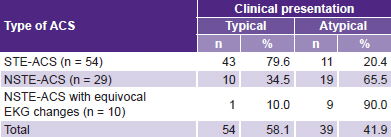
We also analyzed clinical presentation for the different types of ACS in patients with increased QTc interval and found significant differences (p < 0.001). Typical presentation was predominant for STE-ACS patients (43/54, 79.6%), as it was for patients with the same type of ACS but normal QTc dispersion (Table 3). In contrast, the majority of patients with NSTE-ACS and NSTE-ACS with equivocal EKG changes had atypical presentation: 19/29 (65.5%) and 9/10 (90%), respectively (Table 4).
There were patients with atypical clinical presentation in which electrical changes were not helpful in discerning whether these cases involved acute or chronic changes, presence of secondary repolarization abnormalities, nonspecific repolarization abnormalities or tracings without ST–T-segment abnormalities; thus, it was decided to consider each situation separately. Table 5 shows QTc dispersion and EKG findings. A statistically significant association was observed between QTc dispersion and whether EKG findings were definitive: increased QTc dispersion was present in fewer than half of those with unequivocal EKG but two thirds of those with equivocal EKGs (21/31) had increased QTc dispersion (p = 0.05).
DISCUSSION
QT interval measurement and correction on EKGs of patients with suspected ACS provides a particularly useful electrocardiographic parameter for diagnosing coronary events in patients whose initial EKGs lack typical known changes, where secondary repolarization abnormalities—determined by an abnormal activation sequence—prevent accurate ST-segment analysis. QT changes are also valuable because of how rapidly they appear, often preceding ST-segment or T-wave changes.[27–29]
Table 2: QTc interval dispersion by type of ACS (n = 194)
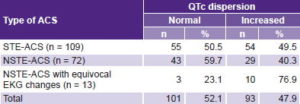
p = 0.045 / X2 = 6.181 / ACS: acute coronary syndrome / NSTE: non-ST elevation / QTc: corrected QT interval / STE: ST elevation
Table 3: Normal QTc interval dispersion, by clinical presentation and ACS type (n = 101)
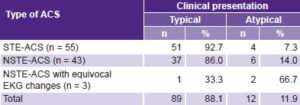
p = 0.007 / X2 = 9.893 / ACS: acute coronary syndrome / NSTE: non-ST elevation / QTc: corrected QT interval / STE: ST elevation
Table 4: Increased QTc interval dispersion by clinical presentation and ACS type (n = 93)
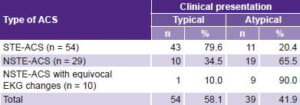
p < 0.001 / X2 = 26.424 / ACS: acute coronary syndrome / NSTE: non-ST elevation / QTc: corrected QT interval / STE: ST elevation
Table 5: QTc interval dispersion by EKG findings (n = 194)
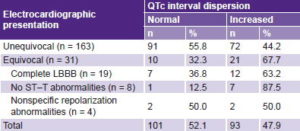
p = 0.05 / X2 = 7.714 / LBBB: left bundle branch block / QTc: corrected QT interval
In our study, STE-ACS was more frequent than NSTE-ACS, and increased QTc dispersion was somewhat more frequent in the former than in the latter. This result is similar to research findings at the Manuel Fajardo Rivero Military Hospital in Santa Clara, Cuba, in a study of patients admitted with a diagnosis of ACS in 2008. STE-ACS was more common (60%), and 24% of STE-ACS patients showed increased QT dispersion. Among NSTE-ACS cases (21%), 13% had increased dispersion of repolarization. Among patients with equivocal EKG findings, increased QT dispersion was six times as common as normal dispersion,[30] results similar to ours.
A Turkish study of 137 patients with chest pain and equivocal initial EKG found that patients eventually diagnosed with ACS (51, 37%) had greater QTc dispersion than patients without ACS (46.1 ± 16.3 vs. 38.1 ± 18.2, p = 0.009).[31] A study in Salamanca, Spain looked at the relationship between QTc interval obtained at admission in patients with atypical presentation and low or intermediate risk of ACS, and the severity and magnitude of myocardial ischemia, identified via stress test. It found that the QTc interval was greater in patients with an abnormal stress test, where the best cut-off point was 450 ms (sensitivity, specificity and negative predictive value: 81%, 77% and 84%). This demonstrated that QT prolongation alone may constitute a diagnostic clue in EKG assessment of patients with suspected acute coronary events.[32] Our study did not look at QTc prolongation, only its dispersion; for more complete and reliable EKG analysis, both parameters should be considered.
Our observations that both STE-ACS and NSTE-ACS may present atypically are consistent with previous reports. When presentation is atypical, EKG evidence is needed, based on internationally well-defined criteria for ST elevation or depression.[25]
It was interesting to find that the largest number of cases without ST-segment abnormalities had increased repolarization dispersion. The hypothetical argument for this observation is that in some patients, the EKG might have been done very early. In 2007, an article was published that led to modification of the classic ischemic cascade concept, demonstrating in 100% of cases studied that the earliest event in ischemia is QTc interval prolongation and its increased dispersion.[33] The early appearance of QTc interval abnormalities is precisely one of its greatest advantages for ACS diagnosis, since it provides evidence of the disease when, in many cases, ST-segment abnormalities have not yet been demonstrated.[31–35]
A study in Buenos Aires, Argentina, involving patients with typical symptoms and enzyme abnormalities compatible with ischemia but without ST changes on EKG, found prolonged QTc interval and increased dispersion, primarily in cases with adverse clinical events.[36] This paper showed the importance of measuring QT interval and calculating QTc in patients with normal EKG and suspected ACS. In our study, the interval was measured in patients presenting with equivocal EKG and atypical symptoms. Another paper observed that in 34%–54% of patients with ACS, the ST segment did not show abnormalities on arrival at hospital, and its subsequent course was quite heterogeneous.[5]
Increased repolarization dispersion was also common in patients with complete left bundle branch block. This conduction abnormality implies secondary changes in ventricular repolarization that hinder or complicate ST-segment analysis. Many signs used for left bundle branch block diagnosis have fallen into disuse because of low sensitivity and specificity; e.g., Cabrera sign, Chapman sign or presence of Q-waves.[27] For diagnosis of ischemia in complete left bundle branch block, the American Heart Association only recommends ST-segment elevation or depression >1 mm in leads with positive or negative QRS complexes, respectively (concordant pattern), or elevation of >5mm with negative QRS complexes (discordant pattern). In these patients, a finding of increased repolarization dispersion plays a key role as an additional diagnostic indicator.[25]
In our view, there is ample evidence pointing to the importance of cardiac biomarkers in ACS diagnosis and prognosis.[37–40] However, for countries that lack the resources for advanced diagnostic technologies, it is important to continue studying all EKG variables (wave, segment and interval measures) that are likely to change in the presence of ischemic heart disease, to better support ACS diagnosis and management.
The study’s small number of patients—especially those with equivocal EKG signs and/or atypical presentation—limited our findings’ generalizability. However, it adds to the growing body of evidence of the potential utility of QTc interval changes as diagnostic variables and probable independent risk markers in the range of possible ACS scenarios.
CONCLUSIONS
Increased QTc interval dispersion constitutes an important diagnostic tool, in both STE-ACS and NSTE-ACS, and is even more important when patients present with atypical symptoms and when universally validated EKG criteria for ACS are not fulfilled. Especially important is QT interval measurement when ACS is suspected but presentation is atypical and/or EKG changes equivocal. Its use could assist earlier diagnosis and improved care for such patients, especially in resource-constrained settings where more expensive higher-technology tests are less accessible than EKG.