image
Original Research
Spatial Distribution of Unspecified Chronic Kidney Disease in El Salvador by Crop Area Cultivated and Ambient Temperature
https://doi.org/10.37757/MR2014.V16.N2.6

INTRODUCTION Chronic kidney disease of unknown etiology is occurring in various geographic areas worldwide. Cases lack typical risk factors associated with chronic kidney disease, such as diabetes and hypertension. It is epidemic in El Salvador, Central America, where it is diagnosed with increasing frequency in young, otherwise-healthy male farmworkers. Suspected causes include agrochemical use (especially in sugarcane fields), physical heat stress, and heavy metal exposure.

OBJECTIVE To evaluate the geographic relationship between unspecified chronic kidney disease (unCKD) and nondiabetic chronic renal failure (ndESRD) hospital admissions in El Salvador with the proximity to cultivated crops and ambient temperatures.

METHODS Data on unCKD and ndESRD were compared with environmental variables, crop area cultivated (indicator of agrochemical use) and high ambient temperatures. Using geographically weighted regression analysis, two model sets were created using reported municipal hospital admission rates per ten thousand population for unCKD 2006–2010 and rates of ndESRD 2005–2010. These were assessed against local percent of land cultivated by crop (sugarcane, coffee, corn, cotton, sorghum, and beans) and mean maximum ambient temperature, with Moran’s indices determining data clustering. Two-dimensional geographic models illustrated parameter spatial distribution.

RESULTS Bivariate geographically weighted regressions showed statistically significant correlations between percent area of sugarcane, corn, cotton, coffee, and bean cultivation, as well as mean maximum ambient temperature with both unCKD and ndESRD hospital admission rates. Percent area of sugarcane cultivation had greatest statistical weight (p =0.001; Rp2 = 0.77 for unCKD). The most statistically significant multivariate geographically weighted regression model for unCKD included percent area of sugarcane, cotton and corn cultivation (p =0.001; Rp2 = 0.80), while, for ndESRD, it included the percent area of sugarcane, corn, cotton and coffee cultivation (Rp2 = 0.52). Univariate unCKD and ndESRD Moran’s I (0.20 and 0.33, respectively) indicated some degree of clustering. Ambient temperature did not improve multivariate geographically-weighted regression models for unCKD or ndESRD. Local bivariate Moran’s indices with relatively high positive values and statistical significance (0.3–1.0, p =0.05) indicated positive clustering between unCKD hospital admission rates and percent area of sugarcane as well as cotton cultivation. The greatest positive response for clustering values did not consistently plot near the highest temperatures; there were some positive clusters in regions of lower temperatures. Clusters of ndESRD were also observed, some in areas of relatively low chronic kidney disease incidence in western El Salvador.

CONCLUSIONS High temperatures do not appear to strongly influence occurrence of unCKDu proxies. CKDu in El Salvador may arise from proximity to agriculture to which agrochemicals are applied, especially in sugarcane cultivation. The findings of this preliminary ecological study suggest that more research is needed to assess and quantify presence of specific agrochemicals in high-CKDu areas.

KEYWORDS Chronic kidney disease, chronic renal failure, ESRD, geographically weighted regression, sugarcane, agrochemicals, El Salvador

image

ABSTRACT
INTRODUCTION Chronic kidney disease of unknown etiology is occurring in various geographic areas worldwide. Cases lack typical risk factors associated with chronic kidney disease, such as diabetes and hypertension. It is epidemic in El Salvador, Central America, where it is diagnosed with increasing frequency in young, otherwise-healthy male farmworkers. Suspected causes include agrochemical use (especially in sugarcane fields), physical heat stress, and heavy metal exposure.

OBJECTIVE To evaluate the geographic relationship between unspecified chronic kidney disease (unCKD) and nondiabetic chronic renal failure (ndESRD) hospital admissions in El Salvador with the proximity to cultivated crops and ambient temperatures.

METHODS Data on unCKD and ndESRD were compared with environmental variables, crop area cultivated (indicator of agrochemical use) and high ambient temperatures. Using geographically weighted regression analysis, two model sets were created using reported municipal hospital admission rates per ten thousand population for unCKD 2006–2010 and rates of ndESRD 2005–2010. These were assessed against local percent of land cultivated by crop (sugarcane, coffee, corn, cotton, sorghum, and beans) and mean maximum ambient temperature, with Moran’s indices determining data clustering. Two-dimensional geographic models illustrated parameter spatial distribution.

RESULTS Bivariate geographically weighted regressions showed statistically significant correlations between percent area of sugarcane, corn, cotton, coffee, and bean cultivation, as well as mean maximum ambient temperature with both unCKD and ndESRD hospital admission rates. Percent area of sugarcane cultivation had greatest statistical weight (p ≤0.001; Rp2 = 0.77 for unCKD). The most statistically significant multivariate geographically weighted regression model for unCKD included percent area of sugarcane, cotton and corn cultivation (p ≤0.001; Rp2 = 0.80), while, for ndESRD, it included the percent area of sugarcane, corn, cotton and coffee cultivation (Rp2 = 0.52). Univariate unCKD and ndESRD Moran’s I (0.20 and 0.33, respectively) indicated some degree of clustering. Ambient temperature did not improve multivariate geographically-weighted regression models for unCKD or ndESRD. Local bivariate Moran’s indices with relatively high positive values and statistical significance (0.3–1.0, p ≤0.05) indicated positive clustering between unCKD hospital admission rates and percent area of sugarcane as well as cotton cultivation. The greatest positive response for clustering values did not consistently plot near the highest temperatures; there were some positive clusters in regions of lower temperatures. Clusters of ndESRD were also observed, some in areas of relatively low chronic kidney disease incidence in western El Salvador.

CONCLUSIONS High temperatures do not appear to strongly influence occurrence of unCKDu proxies. CKDu in El Salvador may arise from proximity to agriculture to which agrochemicals are applied, especially in sugarcane cultivation. The findings of this preliminary ecological study suggest that more research is needed to assess and quantify presence of specific agrochemicals in high-CKDu areas.

KEYWORDS Chronic kidney disease, chronic renal failure, ESRD, geographically weighted regression, sugarcane, agrochemicals, El Salvador

INTRODUCTION
Chronic kidney disease (CKD) is the slow loss of kidney function over time, leaving the body unable to properly filter wastes. In 2013, CKD was estimated to affect 8–16% of the world population.[1] WHO classifies CKD in stages of increasing severity by decreasing glomerular filtration rate (GFR).[2] CKD can originate from damage of renal tubules, interstitium, glomeruli or blood vessels.[3] The terminal stage of CKD is known as end-stage renal disease (ESRD); it is irreversible and requires dialysis or transplantation for survival.[3]

In recent decades, growing concern has arisen about CKD of unknown etiology (CKDu) emerging in various geographic areas, including Sri Lanka,[4] India,[5] and some Central American countries (El Salvador, Nicaragua, Costa Rica and Panama).[6–9] CKD is typically associated with risk factors such as diabetes and hypertension,[2,10] whereas CKDu occurs in young, otherwise-healthy populations.[4,5,8,9,11–14] CKDu primarily originates in the tubules and interstitium,[8,13–16] consistent with injury from exogenous toxins.[3]

El Salvador’s Ministry of Health (MINSAL, the Spanish acronym) has initiated studies to seek the cause of high CKDu admission rates: In 2005–2010 more than 16,000 patients were admitted to hospital with a diagnosis of unspecified CKD (unCKD), used here as a proxy for CKDu (August, 2011, e-mail from DS Rodríguez, Ministry of Health to Dina López). These are extremely high numbers in a population of only 6.3 million (2012).[17]

Furthermore, the number of case reports is increasing at a dramatic rate: by 50% from 2005 to 2012.[9] A kidney health research team began with a pilot examining the region of Bajo Lempa, Usulután in 2009 and found that 18% of the local population had CKD.[18] This research program has since expanded to include populations in other regions of El Salvador. Reported CKD patients lack characteristic risk factors;[12,18] however, the causes remain unknown.

Although CKDu etiology is unidentified, there is evidence suggesting that exposure to environmental conditions or substances could induce renal damage. Two primary suspects are heat stress[16,19] and exposure to toxic agrochemicals.[12,13,18]

Heat stress resulting from strenuous manual labor coupled with dehydration and lengthy exposure to high ambient temperatures could lead to kidney damage.[16,19] Drinking less than the recommended minimum amount of water while working in the sun can exacerbate this effect.[20] The Thai Cohort Study of >17,000 men found that chronic occupational heat exposure more than doubled CKD risk.[21]

CKDu is correlated with agricultural work,[22] especially sugarcane cultivation.[8,12] Pesticides and synthetic fertilizers are used in agriculture to eliminate weeds and insects and to increase crop yields. In 2005–2010, El Salvador imported almost 16 million kg of pesticides, with an increase of 171% over the period (Ministry of Economy database for imported pesticides). This results in an extremely high ratio of 2.5 kg of pesticides per person over the 6-year period, considering that El Salvador’s population is concentrated in a relatively small land area (21,040 km2).[17] The leading three pesticides imported in 2010 were 2,4-D, 5.37 million kg; glyphosate, 2.74 million kg; and paraquat, 0.81 million kg (Ministry of Economy database for imported pesticides). Each of these can produce renal damage.

Glyphosate is commonly applied to sugarcane preharvest as a “ripener” to increase sucrose concentration.[23] Exposure to glyphosate increases urea and uric acid in blood and produces substantial oxidative stress due to presence of reduced oxygen species.[24] Reactive oxygen species extract electrons from the lipid membranes of renal tubular cells leading to loss of renal function. They can collect electrons from proteins, too, which can alter DNA bases; with repeated exposure, this cellular damage can eventually lead to kidney failure.[25] Jayasumana suggests that glyphosate is a potential cause of CKDu in Sri Lanka and proposes further investigation of the effects of glyphosate and glyphosate chelates on kidney tissue.[26]

Hedonal (2,4-D), is an herbicide that can affect renal function. A study of Minnesota and South Carolina farming families regularly using 2,4-D found that applicators had higher mean urine concentrations of the pesticide than did their spouses and children (71.9 µg/L vs. 1.7 µg/L and 4.9 µg/L, respectively);[27] 2,4-D concentration was proportional to direct contact with agrochemicals, correlated with use of personal protective equipment, application land area, loads applied and equipment repair. Tubular epithelial cell damage along with a widened tubular lumen and vascular congestion has been demonstrated in pregnant and nursing rats and their litters after ingestion of 600 μg/L of 2,4-D in drinking water.[28] After sufficient damage in acute or chronic cases of 2,4-D intoxication, anion transport capacity is impaired.[29]

Paraquat is a toxic herbicide with an oral reference dose set by USEPA at 4.5 µg/kg/day.[30] Paraquat-induced kidney damage can cause high levels of creatinine and uric acid in the blood, cause hyperuricemia or produce reactive oxygen species.[31–33]

According to El Salvador’s 2007 agricultural census, corn covers the highest percent of land area, at 11.6% followed by coffee (7%), sorghum (3.7%), beans (3.3%), sugarcane (3%) and cotton (0.1%).[34] Therefore, 28.7% of the land is cultivated with major crops, and is likely to be treated with agrochemicals.

We hypothesized that geographic variation in unspecified CKD (unCKD) and nondiabetic ESRD (ndESRD) hospital admissions might arise from differing percentages of land used for sugarcane, corn, cotton, coffee, beans and sorghum crops (an indicator of agrochemical use) as well as elevated ambient temperatures. Proximity to agricultural land may increase exposure to nephrotoxic agrochemicals. Locations of unCKD and ndESRD clusters should reflect crop type, assuming the agrochemicals and amount of agrochemicals applied to each crop varies. There should also be greater concentrations of unCKD and ndESRD hospital admissions in regions with higher temperatures, where heat stress and dehydration may be more frequent. Consequently, this study seeks to evaluate the geographic relationship between unCKD and ndESRD hospital admissions in El Salvador with proximity to cultivated crops and areas of varying ambient temperatures.

METHODS
Study type and population This is an exploratory ecological study. The study universe consisted of all patients admitted to hospital with unCKD in 2005–2010 (n = 16,384) and ndESRD patients admitted in 2006–2010 (n = 8342).

Study variables Dependent variables were municipal residents’ admission to public hospitals with unCKD (2005–2010) and ndESRD (2006–2010), as rates per ten thousand population (ptp), both used as proxies for CKDu. ICD-10 definitions were used to classify unCKD and ndESRD.[2] The unCKD data set consisted of 95.5% ICD-10 N18.9 (unspecified CKD, n = 16,384); the remaining 4.5% included N17.9 (unspecified acute renal insufficiency, n = 455), N19 (unspecified renal insufficiency, n = 252), N18.8 (other chronic renal insufficiency, n = 48), N17.0 (acute renal insufficiency with tubular necrosis, n = 9), and N17.8 (other acute renal insufficiency, n = 4). The ndESRD data (n = 8342) comprised N18.0 diagnoses of ESRD lacking secondary diagnosis of diabetes mellitus. Municipal hospital admissions were defined by patients’ permanent residence, not hospital location. Ranges of rates were 0–77.4 ptp for unCKD and 0–15.9 ptp for ndESRD.[35]

Independent variables were percent land area of each municipality cultivated with sugarcane (range: 0–49.3%), corn (1–64.6%), beans (0–36.8%), coffee (0–93.3%), sorghum (0–36.7%), and cotton (0–2%); as well as mean average ambient temperature (17.6–28.1 ºC) and mean maximum ambient temperature in each municipality (23.3–36.7 oC). The number of manzanas (6989 m²) of crops was used to calculate percent area cultivated with each crop per municipality.

Data sources MINSAL provided admission records from public hospitals and clinics for both unCKD and ndESRD for 259 and 242 municipalities, respectively, of the total 262 municipalities in El Salvador. Municipal rates of unCKD and ndESRD hospital admissions were calculated with population data from the El Salvador Census of 2007.[35] El Salvador’s Ministry of Environment and Natural Resources (MARN, the Spanish acronym) provided ambient temperature data 1970–2000 from its monitoring of 25 weather stations nationwide (Apr 20, 2012 e-mail from I. Rodríguez, MARN, to Dina López). Agricultural variables came from the Ministry of the Economy 2007–2008 Agricultural Census of El Salvador.[34] Data are available online in Supporting Information (Table S1) at www.medicc.org/mediccreview/VanDervort_data

Data analysis The mean average and maximum ambient temperatures per municipality were interpolated with the contour modeling software SURFER. SURFER models were generated using exponential variograms and the spatial analytical method kriging to predict unknown values from the average of known adjacent values, weighted according to proximity. Temperature maps at

0.2 ºC contour intervals were overlaid with post maps of the average Universal Transverse Mercator (UTM) surface coordinates corresponding with all 262 municipalities to acquire respective temperature values.

Geographically Weighted Regression (GWR) The data variables are distributed over the surface of El Salvador and depend on the geographic coordinates of the different municipalities. To determine influence of independent variables on dependent variables considering their relative arrangement in space, we used GWR models via the computer program GWR4.[36] The dependent variable (zi) is described as:

where vk,i, is the kth independent variable, ei is the Gaussian error at location i, m is the number of regressed independent variables, and (xi, yi) are the coordinates of ith location. The coefficient ßk does not necessarily remain constant for the entire domain; it can vary depending on geographic location.[37] When ßk is constant for the entire domain, the variable is considered global.[36] When ßk varies throughout the domain, the variable is local.[37] When considering both global and local trends, the equation for the dependent variable is:

where ul,i is the lth independent variable, ƛl is the constant coefficient for that variable, and p and q are the number of local and global independent variables, respectively. A Gaussian distribution model was used for all simulations with GWR4. These models allow a better interpretation of correlations and effects of independent variables on dependent variables since they are geographically distributed.

Independent variables were increased one by one in each subsequent model. For models with p <0.05, the F test evaluated the significance of the additional variables for improving the regression model. The F statistic between two sequential models was calculated using the following equation:

The subscripts 1 and 2 denote values from the baseline model and the model with an added variable, respectively. Model 2 has a larger number of regression parameters (np2 > np1). SSD is the sum of squares of the residual or deviation from expected values, and n is the number of data points. The F statistic’s p values were calculated, and the lowest p value selected as the best regression model.[38] If the calculated F statistic was lower than the critical F value, the variable did not significantly improve the regression. In addition, models with the greatest adjusted coefficient of determination (Rp2) were considered to be the best fits (F test p<0.05).

Moran Indices Spatial autocorrelation analysis was applied to understand the degree to which unCKD and ndESRD hospital admission municipal rates ptp were related to percent area of crop cultivation and mean maximum ambient temperature at global and local scales. The computer program GeoDa was used to calculate global and local Moran’s I values,[39–41] which evaluate spatial patterns for clustering. Using the k-neighbor approach, a binary weight matrix assigned weights to the six nearest neighbors and zero for non-neighbors. For global univariate spatial autocorrelation, the calculated Moran’s I determined if clusters of unCKD and ndESRD existed in El Salvador. The Moran’s I statistic for spatial autocorrelation is defined as follows:

where n is the number of samples. The row standardized spatial weights matrix term, Wij, is one if i,j are neighbors and zero if they are not. z is the average value of the variable, and: 
Moran’s I values were then compared with the value expected if the variable were randomly distributed in the area:
 Moran’s I values range from -1 to +1 for disperse and clustered data, respectively. Moran’s I of zero corresponds to spatially random data. Values between zero and one were of interest because they indicated varying degrees of clustering. Local spatial autocorrelation identifies the location of clusters of univariate and bivariate data sets. The local Moran’s I can be calculated using Anselin local Moran’s I with the equation:
 
where Wij(d) is the row-standardized weight matrix generated with a local neighborhood search for a radius d.[42] For a random distribution without clusters of the variable, the expected value is given by:
 
The expected values vary by location; the probability of clustering at each location can be different.

Spatial distribution maps Spatial distribution maps of trends were created in SURFER using kriging methods to illustrate the study variables. Exponential variograms were used to generate maps. Municipalities were assessed as single points, rather than areas of land. So to identify spatial trends, we focused on groups of municipalities, such as departments. Post maps of significant Moran’s I values were overlaid on the maps.

RESULTS
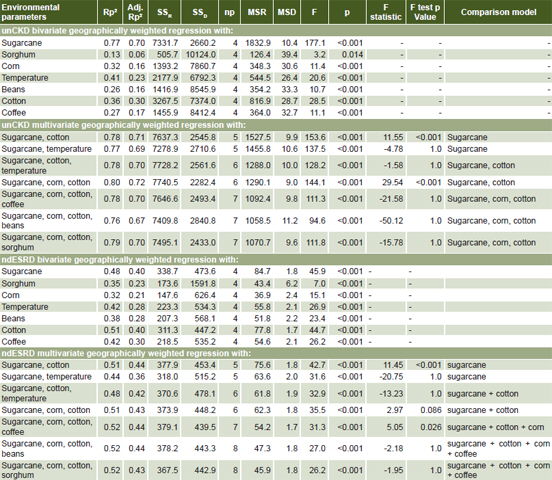
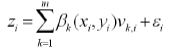
GWR All independent variables produced significantly correlated models with both unCKD and ndESRD hospital admission rates separately (p < 0.001, Table 1), except for unCKD admission and percent area of sorghum cultivation. Mean maximum ambient temperature was used to represent temperature variation in multivariate regression models because it correlated more strongly with unCKD and ndESRD hospital admission rates than did mean average ambient temperature

Table 1: unCKD hospital admissions ptp and environmental parameters (n = 259 municipalities); and ndESRD and environmental parameters (n = 242 municipalities), multiple stepwise geographically-weighted regression analysis


Adj. Rp2 : adjusted Rp2 (if no change or lower, adding variable does not improve model)
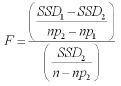
MSD: mean square of the deviation
MSR: mean square of the regression
ndESRD: nondiabetic end-stage renal disease
np: number of environmental parameters in model
ptp: per ten thousand population
Rp2: coefficient of multiple determination, higher number means better model
SSD: sum of squares of the residual
SSR: sum of squares of the regression
unCKD: unspecified chronic kidney disease

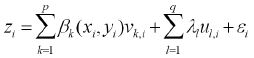
Percent area of sugarcane cultivation produced the greatest bivariate regressions (Rp2 = 0.77 and 0.48 for unCKD and ndESRD, respectively). Therefore, these models were used as restricted bases in the F tests to verify significance of adding other parameters. In the unCKD model set, the most significantly predictive regression model included percent area of sugarcane, cotton and corn cultivation (Rp2 = 0.80, Table 1). Thus, 80% of the variation in unCKD hospital admission distribution is reflected by proportional variation of these three crops. Multivariate models for ndESRD admission rates had much lower coefficients of determination, with the most significant model producing Rp2 = 0.52 for percent area of sugarcane, corn, cotton and coffee cultivation (Table 1). Percent areas of bean and sorghum cultivation did not significantly improve fit for either model, according to relatively high F test p values. For unCKD and ndESRD, adding the average maximum temperature as a regressor variable did not significantly improve the model.

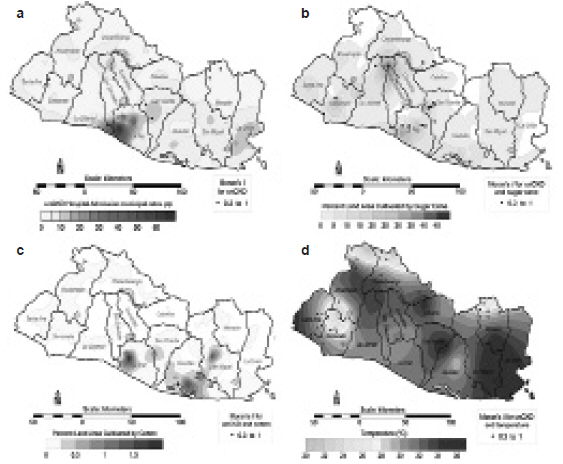
Distribution Maps and Moran’s I The areas of highest unCKD admission rates were located in the southwestern municipalities of La Paz Department (up to 77.4 ptp), southern San Salvador Department (up to 14.4 ptp), and southeastern La Libertad Department (up to 11.4 ptp) (Figure 1a). Dots in the Figures represent clusters determined with the local Moran’s I. Regions with greatest percent areas of sugarcane cultivation were in northern San Salvador (up to 49.3%), southwestern and central La Paz (up to 38.1%), northeastern San Vicente (37.4%), and central Sonsonate (37.1%) (Figure 1b). Percent area of cotton cultivation was greatest in west-central La Paz (up to 1.96%), central San Miguel (up to 1.7%) and southern Usulután (up to 1.65%) (Figure 1c). Highest temperatures were in the southeastern municipalities of San Miguel (up to 35.3 ºC) and La Union (up to 35.2 ºC) (Figure 1d). The map for ndESRD admissions is similar to that for unCKD hospital admissions and is available online in Supporting Information, as well as maps of percent area corn, coffee, bean and sorghum cultivation; and mean average ambient temperature (Figures S1–6, available online at www.medicc.org/mediccreview/VanDervort_Fig)

Figure 1: Clusteringa of unCKD by municipalityb, sugarcane and cotton cultivationc, and temperatured


a univariate local Moran’s I values for positive unCKD clustering; only clusters with Moran’s I ≥0.3
and p < 0.05 are plotted
b municipal rates/10,000 population 2006–2010
c % of area cultivating each crop in 2007–2008
d mean maximum ambient temperature 1970–2000
(figures in color available at www.medicc.org/mediccreview/VanDervort_Fig)

Areas with largest percent area of sugarcane and cotton cultivation were similar to areas with highest unCKD admission rates. However, there was an area of relatively high unCKD hospital admission rates in southeastern El Salvador that was not reflected in percent area of sugarcane cultivation. This area was in the region of highest ambient temperatures (33–36 ºC), corresponding to La Unión and San Miguel states (Figure 1d).

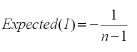
Global univariate Moran’s I was 0.20 for unCKD and 0.33 for ndESRD, which indicates some degree of clustering. Global bivariate Moran’s I for unCKD association with percent area of sugarcane, cotton and corn cultivation; and mean maximum temperature were 0.11, 0.22, 0.11, and 0.12, respectively. For ndESRD, Moran’s I was 0.12, 0.21, 0.09, and 0.24, respectively for the same variables. Figures 1a–d also show post maps of local univariate and bivariate Moran’s I values of 0.3–1.0 (p ≤0.05). Moran’s I values in Figure 1a identify clustering of unCKD admissions; those in Figures 1b–d show positive clustering for unCKD hospital admission rates with percent area of sugarcane and cotton cultivation, and mean maximum ambient temperature, respectively. Focusing on Moran’s I values with the greatest positive response for clustering (I = 0.3–1.0), the clusters of unCKD hospital admission rates were located near the regions of highest values of the unCKD hospital admission rate variable. Moran’s I values of greatest positive response for clustering were near areas of largest percent area of sugarcane and cotton cultivation. The clustering pattern was different, however, in Figure 1d, where the greatest positive response for clustering values did not consistently plot near the highest temperatures; there were some positive clusters in regions of lower temperatures. Clusters of ndESRD were also observed (Figure S1 in Supporting Information), with some occurring in areas of relatively low CKD incidence in western El Salvador. Note that some clusters are a little offset with respect to the maximum in the graph. From the definition of Moran’s I, the index depends not only on the value at the point but also on the values of neighboring points. For bivariate local Moran’s I, the value depends on two variables (e.g., unCKD and percent area of sugarcane) which can also produce some offset.

DISCUSSION
Bivariate GWR found the principal parameter predicting municipal unCKD hospital admission rates was percent area of sugarcane cultivation, followed by mean maximum ambient temperature, percent cotton cultivation and percent corn cultivation. This suggests that proximity to agriculture (especially sugarcane) along with high ambient temperatures may influence the rate of unCKD in El Salvador.

Stepwise GWR showed that unCKD hospital admission rates are best predicted by percent area of sugarcane, cotton and corn cultivation; percent area of sorghum, beans, or coffee, and mean maximum ambient temperature did not improve the model. These differences could be explained by the distributions of the specific crops cultivated. Coffee is usually cultivated in high regions of El Salvador’s volcanic chain. Beans and sorghum are cultivated usually in small plots of land, while sugarcane and cotton are cultivated on large tracts. Corn is the most commonly cultivated crop in El Salvador. The amount and variety of agrochemicals applied to specific crops could also explain the GWR results, if more harmful chemicals or greater amounts of them are applied to sugarcane, cotton and corn fields. This needs to be assessed and quantified. Many pesticides with paraquat, glyphosate, and 2,4-D as active ingredients have been restricted in some developed countries,[43] but are still in use in El Salvador and other countries, without adequate understanding of exposure consequences. Assuming that agrochemicals are applied to agricultural fields in El Salvador (a plausible assumption, given the amount of pesticides imported), the associated toxins could be compromising kidney health, especially if there is substantial physical contact.

In 2011, Bajo Lempa farmers with CKDu were interviewed about their agrochemical use.[44] Results showed potential CKDu causes in this population were unsafe and prolonged use of agrochemicals and underuse of personal protective equipment. Accumulation of persistent contaminants in soil, water, or atmosphere may also increase threat to health. Occupational exposure may explain the sex difference in CKDu prevalence in Bajo Lempa in 2009 (25.7% in men and 11.8% in women).[18] However, without knowing the specific toxin and exposure route, it is difficult to characterize the male:female imbalance.

In another study in El Salvador, a high prevalence of CKD was found in men living near the hotter coast (18%) than in the cooler highlands (1%).[15] Statistical analysis did not reveal significant differences between sugarcane work and other occupations, which is not consistent with our results. However, in that study the districts located at higher altitudes did not have a high density of sugarcane cultivation, and thus may not have had the same degree of exposure to agricultural toxins.

Cadmium is one of the most nephrotoxic heavy metals. It can produce tubular damage,[45,46] through oxidative stress from unbalanced production of reactive oxygen species, possibly due to cadmium-induced abnormalities in cell mitochondria.[47] In Sri Lanka, CKD of unknown etiology is thought to be caused by cadmium ingestion which is accelerated by in situ fluoride in drinking water.[48] The cadmium source was triple superphosphate fertilizer with 23.5–71.7 mg Cd/kg, which accumulated in river sediment.[48,49] Cadmium concentrations in soil increase with fertilizer application rate and the metal can accumulate in crops grown in soils in which the fertilizer is applied.[50]

In another Sri Lankan study, a relationship was suggested between epidemic kidney disease and consumption of aqueous fluoride and arsenic in hard, alkaline water.[51] In that research, 68% of CKDu patients and only 28% of controls had urine arsenic levels higher than 21 µg/g creatinine (the putative threshold for early changes in the kidney). In addition, 48% of CKDu patients versus only 17.4% of controls were above the threshold level for chronic arsenic toxicity. Other nephrotoxins, such as NSAIDs[7] and consumption of unregulated alcohol[22] have also been proposed as causal factors for CKDu.

The addition of mean maximum ambient temperature did not improve the regression, suggesting that it is not a main factor. This is also confirmed in the spatial distribution maps, showing that areas with higher ndCKD hospital admission rates (Figure 1a) do not correspond with areas of higher mean maximum ambient temperature (Figure 1d). Laborers in Central America have been working in high ambient temperature conditions for hundreds of years. Ambient temperatures on the Pacific coast of western Costa Rica, Nicaragua and southern Honduras are as high or higher than maximum temperatures in El Salvador,[52] but CKDu was not observed in previous generations. High temperatures may be an indirect or potentiating factor, as people need to consume larger quantities of water in hotter climates to account for loss of fluids from perspiration. If available drinking water contains nephrotoxins (i.e., naturally occurring heavy metals or other nephrotoxic compounds), then larger doses may be consumed in hotter regions, influencing kidney health.[4] If they do not consume enough water to compensate for volume depletion, then the concentration of any nephrotoxic compounds would increase in their bodies.

The unCKD and ndESRD data we used were only from public hospitals and clinics. In El Salvador, the majority of the population (~80%) depends on the public health system for medical attention, because of high poverty levels.[53] Only one fifth of the population has access to social security hospitals (affiliated to the national system of health and pension). However, as unCKD is associated with low socioeconomic status,[6] public hospitals may account for an even greater share of unCKD hospital admissions.

A limitation of the study is that data originally tagged “unidentified CKD” might have included some cases with diabetes identified later, which could generate some bias toward the null. This was not true for ndESRD data. The study was also limited by using environmental variables that may be indirectly related to unCKD in El Salvador, and nephrotoxin exposure route is not addressed. This preliminary assessment of the relationships between the disease and broad variables was meant to help determine the most efficient investigative plan. CKDu is a problem seen not only in Central America, but in other countries around the world. It is imperative to continue researching CKDu causes by analyzing water, soil, and produce from sugarcane, cotton, and corn fields, as well as human blood samples to detect toxins. It is also important to analyze the various fertilizers and pesticides sold in El Salvador and other regions with high CKDu occurrence, to determine the composition of heavy metals or other impurities. The route of exposure will then need to be identified to prevent further kidney damage. Meanwhile, our research suggests that regulatory agencies address control of import, sale and application of pesticides and fertilizers, to protect the environment and population.

CONCLUSIONS
High temperatures do not appear to strongly influence occurrence of unCKDu proxies. CKDu in El Salvador may arise from proximity to agriculture to which agrochemicals are applied, especially in sugarcane cultivation. The findings of this preliminary ecological study suggest that more research is needed to assess and quantify presence of specific agrochemicals in high-CKDu areas.

ACKNOWLEDGMENTS
We are indebted to MINSAL, MARN and El Salvador’s Ministry of Agriculture and Livestock Farming for providing data. We thank Dr Paulo Ortiz for assistance with statistical analysis.
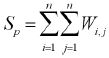
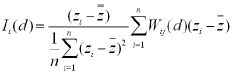
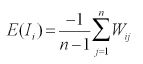
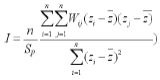
References
image
  1. Jha V, Wang AY, Wang H. The impact of CKD identification in large countries: the burden of illness. Nephrol Dial Transplant [Internet]. 2012 Oct [cited 2013 Nov 25];27 Suppl 3:iii32–8. Available from: http://www.academia.edu/2070987/The_impact_of_CKD_identification_in_large_countries_the_burden_of_illness#
  2. World Health Organization [Internet]. Geneva: World Health Organization; c2014. Classification of Diseases, 1996–2011. List of Official ICD-10 updates. Vol. 1; [cited 2013 Nov 11]. 164 p. Available from: http://www.who.int/classifications/icd/icd10updates/en/
  3. Kumar V, Abbas AK, Aster JC, Fausto N. Robbins and Cotran Pathologic Basis of Disease. 8th ed. Philadelphia: Saunders Elsevier Inc.; 2009 Jun 11. Chapter 20, The Kidney.
  4. Chandrajith R, Nanayakkara S, Itai K, Aturaliya TNC, Dissanayake CB, Abeysekera T, et al. Chronic kidney diseases of uncertain etiology (CKDue) in Sri Lanka: geographic distribution and environmental implications. Environ Geochem Health [Internet]. 2011 Sep 18 [cited 2013 Aug 18];33(3):267–78. Available from: http://link.springer.com/article/10.1007%2Fs10653-010-9339-1
  5. Rajapurkar MM, John GT, Kirpalani AL, Abraham G, Agarwal SK, Almeida AF, et al. What do we know about chronic kidney disease in India: first report of the Indian CKD registry. BMC Nephrol [Internet]. 2012 Mar 6 [cited 2013 Nov 11];13:1–8. Available from: http://www.ncbi.nlm.nih.gov/pmc/articles/PMC3350459/
  6. Trabanino RG, Aguilar R, Silva CR, Mercado MO, Merino RL. Nefropatía terminal en pacientes de un hospital de referencia en El Salvador [End-stage renal disease among patientns in a referral hospital in El Salvador]. Rev Panam Salud Publica [Internet]. 2002 Sep [cited 2013 Aug 18];12(3):202–6. Available from: http://www.scielosp.org/pdf/rpsp/v12n3/12875.pdf. Spanish.
  7. Torres C, Aragón A, González M, López I, Jakobsson K, Elinder CG, et al. Decreased kidney function of unknown cause in Nicaragua: a community-based survey. Am J Kidney Dis [Internet]. 2010 Mar [cited 2013 Aug 18];55(3):485–96. Available from: http://www.nicaragua-forum.de/bioethanol/quellen/studien/Torres_2010_American-Journal-of-Kidney-Diseases%5B1%5D.pdf
  8. Cerdas M. Chronic kidney disease in Costa Rica. Kidney Int [Internet]. 2005 Aug [cited 2013 Aug 18];(97):S31–3. Available from: http://www.nature.com/ki/journal/v68/n97s/pdf/4496413a.pdf
  9. Pan American Health Organization. Chronic kidney disease in agricultural communities in Central America, 152nd Session of the Executive Committee. Washington, DC: Pan American Health Organization; World Health Organization; 2013 Jun 17–21. 20 p.
  10. Solini A, Ferrannini E. Pathophysiology, prevention and management of chronic kidney disease in the hypertensive patient with diabetes mellitus. J Clin Hyperten (Greenwich) [Internet]. 2011 Apr [cited 2013 Aug 18];13(4):252–57. Available from: http://onlinelibrary.wiley.com/ doi/10.1111/j.1751-7176.2011.00446.x/pdf
  11. Ministry of Health (NI). Norma y protocolo para el abordaje de la enfermedad renal crónica. Regulation No. 016. Ministerial Agreement No.: 84-2009 [Internet]. Managua: Ministry of Health (NI); 2009 Mar [cited 2013 Aug 18]. 63 p. http://www.scribd.com/doc/133044337/Norma-y-Protocolo-Para-La-Enfermedad-Renal-Cronica. Spanish.
  12. Orantes CM, Herrera R, Almaguer M, Brizuela EG, Hernández CE, Bayarre H, et al. Chronic kidney disease and associated risk factors in the Bajo Lempa region of El Salvador: Nefrolempa study 2009. MEDICC Rev [Internet]. 2011 Oct [cited 2013 Aug 18];13(4):14–22. Available from: http://www.medicc.org/mediccreview/pdf.php?lang=en&id=221
  13. Athuraliya NTC, Abeysekera TDJ, Amerasinghe PH, Kumarasiri R, Bandara P, Karunaratne U, et al. Uncertain etiologies of proteinuric-chronic kidney disease in rural Sri Lanka. Kidney Int [Internet]. 2011 Dec 1 [cited 2013 Aug 18];80(11):1212–21. Available from: http://www.nature.com/ki/journal/v80/n11/full/ki2011258a.html
  14. Wijkström J, Leiva R, Elinder CG, Leiva S, Trujillo Z, Trujillo L, et al. Clinical and pathological characterization of Mesoamerican nephropathy: a new kidney disease in Central America [Internet]. 2013 Nov [cited 2013 Nov 22];62(5):908–18. Available from: http://www.sciencedirect.com/science/article/pii/S0272638613009153
  15. Peraza S, Wesseling C, Aragon A, Leiva R, García RA, Torres C, et al. Decreased kidney function among agricultural workers in El Salvador. Am J Kidney Dis [Internet]. 2012 Apr [cited 2013 Aug 18];59(4):531–40. Available from: http://download.journals.elsevierhealth.com/pdfs/journals/0272-6386/PIIS0272638611017859.pdf
  16. O’Donnell JK, Tobey M, Weiner DE, Stevens LA, Johnson S, Stringham P, et al. Prevalence of and risk factors for chronic kidney disease in rural Nicaragua. Nephrol Dial Transplant [Internet]. 2011 Sep [cited 2013 Aug 18];26(9):2798–805. Available from: http://ndt.oxfordjournals.org/content/26/9/2798.full.pdf+html
  17. The World Bank. Data catalog: Population (total) [Internet]. New York: The World Bank Group; 2014 [cited 2014 Apr 12]. Available from: http://data.worldbank.org/indicator/SP.POP.TOTL
  18. Orantes CM. Enfermedad Renal Crónica y factores de riesgo en el Bajo Lempa, El Salvador: Estudio Nefrolempa. San Salvador: Ministry of Health (SV); 2010 Jul. 154 p. Spanish.
  19. Brooks DR, Ramírez O, Amador JJ. CKD in Central America: a hot issue. Am J Kidney Dis [Internet]. 2012 Apr [cited 2013 Aug 18];59(4):481–4. Available from: http://download.journals.elsevierhealth.com/pdfs/journals/0272-6386/PIIS0272638612000297.pdf
  20. Hernández JR, López CE, Avila JE, Hernández KE. Prevalencia, factores y agentes de riesgo de la enfermedad renal crónica en cuatro localidades de El Salvador [Internet]. San Salvador: University “Doctor Andrés Bello”, Department of Research and Social Outreach; 2010 [cited 2013 Aug 18]. 102 p. Available from: http://www.google.com.cu/url?sa=t&rct=j&q=&esrc=s&source=web&cd=1&cad=rja&uact=8&ved=0CCgQFjAA&url=http%3A%2F%2Fwww.paho.org%2Fels%2Findex.php%3Foption%3Dcom_docman%26task%3Ddoc_download%26gid%3D502%26Itemid%3D99999999&ei=AQY_7XODPHUsATXjYG4AQ&usg=AFQjCNHu4-BxICFPu16xRwxDfrW2sXpGzw&bvm=bv.64125504,d.cWc. Spanish.
  21. Tawatsupa B, Lim LL, Kjellstrom T, Seubsman S, Sleigh A; Thai Cohort Study Team. Association between occupational heat stress and kidney disease among 37 816 workers in the Thai cohort study (TCS). J Epidemiol. 2012 May;22(3):251–60.
  22. Sanoff SL, Callejas L, Alonso CD, Hu Y, Colindres RE, Chin H, et al. Positive association of renal insufficiency with agriculture employment and unregulated alcohol consumption in Nicaragua. Renal Fail [Internet]. 2010 [cited Aug 18];32(7):766–77. Available from: http://www.ncbi.nlm.nih.gov/pmc/articles/PMC3699859/
  23. Subiros JF. The effect of applying glyphosate as ripener in three sugar cane varieties. Turrialba. 1990;40(4):527–34.
  24. El-Shenawy NS. Oxidative stress responses of rats exposed to roundup and its active ingredient glyphosate. Environ Toxicol Pharmacol [Internet]. 2009 Nov [cited 2013 Aug 18];28(3):379–85. Available from: http://www.sciencedirect.com/science/article/pii/S1382668909001100
  25. Van Vleet TR, Schnellmann RG. Toxic nephropathy: environmental chemicals. Semin Nephrol [Internet]. 2003 Sep [cited 2013 Aug 18];23(5):500–8. Available from: http://www.sciencedirect.com/science/article/pii/S0270929503000949
  26. Jayasumana C, Gunatilake S, Senanayake P. Glyphosate, hard water and nephrotoxic metals: are they the culprits behind the epidemic of chronic kidney disease of unknown etiology in Sri Lanka? Int J Environ Res Public Health [Internet]. 2014 Feb 20 [cited 2014 Feb 23];11(2):2125–47. Available from: http://www.mdpi.com/1660-4601/11/2/2125
  27. Alexander BH, Mandel JS, Baker BA, Burns CJ, Bartels MJ, Acquavella JF, et al. Biomonitoring of 2,4-Dichlorophenoxyacetic acid exposure and dose in farm families. Env Health Perspect [Internet]. 2007 Mar [cited 2013 Aug 18];115(3):370–6. Available from: http://www.ncbi.nlm.nih.gov/pmc/articles/PMC1849924/pdf/ehp0115-000370.pdf
  28. Troudi A, Soudani N, Mahjoubi Samet A, Ben Amara I, Zeghal N. 2,4-Dichlorophenoxyacetic acid effects on nephrotoxicity in rats during late pregnancy and early postnatal periods. Ecotoxicol Environ Saf [Internet]. 2011 Nov [cited 2013 Aug 18];74(8):2316–23. Available from: http://www.sciencedirect.com/science/article/pii/S0147651311002193
  29. Garabrant DH, Philbert MA. Review of 2,4-Dichlorophenoxyacetic acid (2,4-D) epidemiology and toxicology. Critic Revs Toxicol [Internet]. 2002 Jul [cited 2013 Aug 18];32(4):233–57. Available from: http://informahealthcare.com/doi/abs/10.1080/20024091064237
  30. United States Environmental Protection Agency [Internet]. Washington DC: United States Environmental Protection Agency; c2014. Integrated Risk Information System: Paraquat (CASRN 1910-42-5); [updated 2012 Aug 9; cited 2014 Mar 7]; [about 3 p.]. Available from: http://www.epa.gov/iris/subst/0183.htm
  31. Hong SY, Yang DH, Hwang KY. Associations between laboratory parameters and outcome of paraquat poisoning. Toxic Letters [Internet]. 2000 Dec [cited 2013 Aug 13];118(1–2 ):53–9. Available from: http://ac.els-cdn.com.ezproxy2.library.arizona.edu/S0378427400002642/1-s2.0-S0378427400002642-main.pdf?_tid=d7df5d90-0abb-11e3-bacd-00000aab0f26&acdnat=1377128944_b5d2bc4718a947d945f031f264e39343
  32. Kim S, Gil H, Yang J, Lee E, Hong S. The clinical features of Acute Kidney Injury in patients with acute paraquat intoxication. Nephro Dial Transplant [Internet]. 2009 [cited 2013 Aug 18];24(4):1226–32. Available from: http://ndt.oxfordjournals.org/content/24/4/1226.full.pdf+html
  33. Kim JH, Gil HW, Yang JO, Lee EY, Hong SY. Serum uric acid level as a marker for mortality and Acute Kidney Injury in patients with acute paraquat intoxication. Nephro Dial Transplant [Internet]. 2011 Jun [cited 2013 Aug 18];26(6):1846–52. Available from: http://ndt.oxfordjournals.org/content/26/6/1846.full.pdf+html
  34. Dada H, Sevilla M. IV censo agropecuario 2007-2008. Resumen de Resultados [Internet]. San Salvador: Ministry of Economy, Vice-ministry of Industry (SV); 2009 Dec [cited 2013 Aug 18]. 74 p. Available from: http://www.fao.org/fileadmin/templates/ess/ess_test_folder/World_Census_Agriculture/Country_info_2010/Reports/ESV_SPA_RES.REP_2008.pdf. Spanish.
  35. Statistics and Census General Division (SV). VI Censo de población y V de vivienda 2007. San Salvador: Ministry of Economy (SV); 2008 Apr [cited 2012 Feb 15]. 659 p. Available from: http://www.censos.gob.sv/util/datos/Resultados%20VI%20Censo%20de%20Poblaci%F3n%20V%20de%20Vivienda%202007.pdf. Spanish.
  36. Nakaya T. GWR4 User Manual, Windows Application for Geographically Weighted Regression Modelling [Internet]. Kyoto: Ritsumeikan University, Department of Geography (JP); 2012 Nov 20 [cited 2014 Feb 18]. Available from: http://www.st-andrews.ac.uk/geoinformatics/wp-content/uploads/GWR4manual_201311.pdf
  37. Fotheringham AS, Brunsdon C, Charlton M. Geographically Weighted Regression: The Analysis of Spatially Varying Relationships. New York: John Wiley & Sons Ltd; 2002. p. 282.
  38. Swan ARH, Sandilands M. Introduction to geological data analysis. Cambridge (MA): Blackwell Science; 1995 Mar 29. 464 p.
  39. Moran PAP. The interpretation of statistical maps. J Royal Stat Soc Series B. 1948;10:243–51.
  40. Gruebner O, Khan MM, Lautenbach S, Müller D, Kraemer A, Lakes T, et al. A spatial epidemiological analysis of self-rated mental health in the slums of Dhaka. Int J Health Geogr [Internet]. 2011 May 20 [cited 2014 Feb 18];10:36. Available from: http://www.ij-healthgeographics.com/content/10/1/36
  41. Anselin L. GeoDa™ 0.9 User’s Guide [Internet]. Illinois: University of Illinois, Spatial Analysis Laboratory. Department of Agricultural and Consumer Economics; Center for Spatially Integrated Social Science. 2003 [cited 2014 Feb 18]. Available from: https://geodacenter.org/downloads/pdfs/geoda093.pdf
  42. Schabenberger O, Gotway CA. Statistical Methods for Spatial Data Analyses. Boca Raton: Chapman & Hall/CRC; 2004 Dec 20. 512 p.
  43. United States Environmental Protection Agency. Restricted use products (RUP) report: updated list [Internet]. 2013 Apr [cited 2014 Feb 18]. 18 p. Available from: http://www.epa.gov/opprd001/rup/rupreport.pdf
  44. López JA, Mejía JR, Quinteros ER. Manejo de agroquímicos que realizan los agricultores mayores o igual a 18 años, con enfermedad renal crónica, no diabéticos, ni hipertensos, en las comunidades Nueva Esperanza, Ciudad Romero y Octavio Ortiz, de municipio de Jiquilisco, departamento de Usulután, en el período de enero a junio de 2011 [thesis]. [San Salvador]: University of El Salvador; 2011. 186 p. Spanish.
  45. Navas A, Tellez M, Guallar E, Muntner P, Silbergeld E, Jaar B, et al. Blood cadmium and lead and chronic kidney disease in US adults: a joint analysis. Am J Epidemiol [Internet]. 2009 Jul 21 [cited 2013 Aug 21];170(9):1156–64. Available from: http://aje.oxfordjournals.org/content/170/9/1156.full.pdf+html
  46. Kobayashi E, Suwazono Y, Dochi M, Honda R, Kido T. Association of lifetime cadmium intake or drinking Jinzu River water with the occurrence of renal tubular dysfunction. Environ Toxicol [Internet]. 2009 Oct [cited 2013 Aug 21];24(5):421–8. Available from: http://onlinelibrary.wiley.com/doi/10.1002/tox.20444/abstract;jsessionid=F86971B6ED57E3E1E2E6A9065E5C50AB.f02t01
  47. Gobe G, Crane D. Mitochondria, reactive oxygen species and cadmium toxicity in the kidney. Toxicol Letters [Internet]. 2010 Sep 15 [cited 2013 Aug 21];198(1):49–55. Available from: http://www.sciencedirect.com/science/article/pii/S0378427410014554
  48. Bandara JM, Wijewardena HV, Liyanege J, Upul MA, Bandara JM. Chronic renal failure in Sri Lanka caused by elevated dietary cadmium: trojan horse of the green revolution. Toxicol Letters [Internet]. 2010 Sep 15 [cited 2013 Aug 21];198(1):33–9. Available from: http://www.sciencedirect.com/science/article/pii/S0378427410014682
  49. Bandara JM, Senevirathna DM, Dasanayake DM, Herath V, Bandara JM, Abeysekara T, et al. Chronic renal failure among farm families in cascade irrigation systems in Sri Lanka associated with elevated dietary cadmium levels in rice and freshwater fish (Tilapia). Environ Geochem Health [Internet]. 2008 Oct [cited 2013 Aug 21];30(5):465–78. Available from: http://link.springer.com/article/10.1007%2Fs10653-007-9129-6
  50. Pérez AL, Anderson KA. DGT estimates cadmium accumulation in wheat and potato from phosphate fertilizer applications. Sci Total Environ [Internet]. 2009 Sep 1 [cited 2013 Aug 21];407(18):5096–103. Available from: http://www.sciencedirect.com/science/article/pii/S0048969709005221
  51. Jayasumana MACS, Paranagama PA, Amarasinghe MD, Wijewardane KMRC, Dahanayake KS, Fonseka SI, et al. Possible link of chronic arsenic toxicity with chronic kidney disease of unknown etiology in Sri Lanka. J Nat Sci Res [Internet]. 2013 [cited 2013 Aug 21];3(1):64–73. Available from: http://www.iiste.org/Journals/index.php/JNSR/article/ view/4193/4246
  52. Weather Forecasts and Reports [Internet]. San Francisco, CA (US): Weather Underground; c2014. Maps and Radars. Weather for Central America; [updated 2014 Apr 8; cited 2013 Nov 25]; [about 1 screen]. Available from: http://www.wunderground.com/global/Region/CA/2xTemperature.html
  53. Institute of Social Security (SV). Memoria de Labores 2007–2008 [Internet]. San Salvador: Ministry of Health (SV); 2009 [cited 2013 Aug 18]. 45 p. Available from: http://www.salud.gob.sv/servicios/descargas/documentos/Documentaci%C3%B3n-Institucional/Memorias-de-Labores/. Spanish.

THE AUTHORS
Darcy Rae VanDervort master’s student in Environmental Sciences, University of Arizona.

Dina L. López (Corresponding author: lopezd@ohio.edu), geologist with a master’s degree in physics, Department of Geological Sciences, Ohio University, Athens, USA.

Carlos M. Orantes Navarro, nephrologist, renal health research coordinator, National Institute of Health, Ministry of Health, San Salvador, El Salvador.

David Saúl Rodríguez, physician with masters degrees in epidemiology and public health, Ministry of Health, San Salvador, El Salvador.


Errata:

The following errata have been corrected in all online versions of this article. 

Page 32, second paragraph of Methods, third line, rates are per thousand population.
Page 35, Figure 1, legend b should read, municipal rates/1000 population 2006–10.

image
Submitted: March 9, 2014
Approved: April 15, 2014
Disclosures: None

VanDervort DR, López DL, Orantes CM, Rodríguez DS. Spatial Distribution of Unspecified Chronic Kidney Disease in El Salvador by Crop Area Cultivated and Ambient Temperature. MEDICC Rev. 2014;16(2):31–38.

image
Loading...
Loading...
Early Online

No new Early Online articles at this time. The most recent articles are listed in the Current Issue Table of Contents. Early Online articles are added as soon as they are available, so please check back later.