INTRODUCTION
According to WHO, a health system comprises all organizations, people and actions whose purpose is to promote, maintain or restore health. Its objectives are to improve population health; respond to people’s nonmedical expectations, and provide financial protection against the costs of ill health, making optimal use of available resources.[1] One of the main responsibilities of the health sector is to reduce the differential consequences of social inequities in health.[2–4] It is important to analyze health system performance in order to improve it and eventually generate necessary reforms.[5]
Health system performance can be measured in different ways. One analytical framework proposed by international organizations examines four interrelated domains: inputs (physical, human and financial); outputs (service delivery, access to services and quality interventions); outcomes (intervention coverage, risk factor reduction); and impact (equity, disease prevalence, health and welfare standards). It identifies relevant indicators and specific data sources for each domain, and considers social determinants of health a contextual element across all four domains.[6] Other analytical frameworks include system structure; socioeconomic and demographic situation; health standards, distribution, perception and determinants; financing; efficiency and equity.[5,7,8]
In Latin America, and Chile in particular, health systems have been studied primarily in relation to inequalities in service delivery and utilization; effects of sectoral reforms on population health; and comparative analysis between countries. These studies have analyzed aspects such as supply and demand of services,[9–12] financing,[9–13] organization and structure,[9–12, 14] expectations and satisfaction with the system,[15] and health outcomes.[9,16,17] Different analytical approaches are habitually used to compare different countries; however, they may be useful for evaluating performance within countries with segmented health systems, such as Chile and many other Latin American countries.[18]
In Chile, a public health insurance subsystem, the National Health Fund (FONASA) coexists with a private health insurance subsystem, health insurance institutions (ISAPRE), and a parallel system in the armed forces. There is no coordination between the public and private subsystems. All fulfill the functions of collection and pooling of funds (i.e., contributions and transfers) and purchasing, and draw on public and private service providers.[9,14,19] In 2013, 76.3% of the Chilean population was covered by FONASA and 18.2% by one of 13 ISAPREs. The remaining 5.5% were covered by the armed forces subsystem or had no health insurance.[20]
The subsystems function with different incentives, logics and regulations. The public and armed forces subsystems operate according to social insurance principles, whereas the private system follows market-based rules. This is reflected in their financing mechanisms, under which employee contributions are variable. In FONASA, financing is linked to income, with a flat-rate premium legally mandated at 7% of salary. FONASA also receives fiscal funding to cover beneficiaries who lack resources; this funding represents 60% of total inputs.[19]
In ISAPREs, by contrast, the base premium is the mandatory contribution, but its value is ultimately tied to individual health risk and number of dependents (the average premium is currently 10% of salary).[19] In practice, ISAPREs function as voluntary private insurance, with mechanisms that allow them to deny coverage to people with pre-existing conditions and to apply discriminatory pricing based on health status, which varies by sex, age and an insured person’s number of dependents.
In terms of benefit packages and financial coverage, FONASA offers a single package with coverage defined according to beneficiary groups classified by ascending level of income, beginning with group A, noncontributing because of lack of resources to group D, the group with the highest contribution. The insured portion is higher for lower-income groups, fluctuating between 80% and 100% in the public provider network, or institutional modality. In the private provider, “free choice” modality, the average insured portion drops to 39.3%.[19] The institutional modality is available through the National Health Services System (SNSS), a network of 29 services organized in three levels of care and initially accessed through primary health care.
ISAPREs, in contrast, have created more than 55,000 different benefits packages, of which more than 11,000 are currently on the market. In 2013, average coverage was 60% for outpatient benefits and 70% for hospitalization.[19] Private insurers do not have a structured health care network, rather they include multiple providers of inpatient and outpatient services that beneficiaries access through either a preferred provider plan or free choice option. As a result, it can be expected that the system’s financing structure and incentives generated may determine the beneficiaries’ risk profile and also influence health outcomes with each type of insurance. It is also possible that such differences in coverage may, in turn, determine differences in the type of care accessed and timeliness of access to services required. An integral analysis could help understand the effects of system segmentation, understood as the coexistence of subsystems with different financing, insured populations and health service delivery modalities, each of which specializes in different population segments, depending on labor force participation, income level, ability to pay and social status.[18] Several publications address inequalities in Chile’s health system, generally emphasizing one particular aspect of the system (such as service delivery, utilization or reforms) and do not compare subsystem performance and impact.[10–13,16,17]
The purpose of this study was to assess the performance of the public and private health insurance systems, and its effects on health inequalities in Chile.
METHODS
An analytical observational study was designed using the WHO framework for evaluating health service performance.[6,21] This framework analyzes health systems by four domains: inputs, outputs, outcomes and impact, considering contextual demographic and social determinants. The unit of analysis was the universe of beneficiaries of public and private health insurance (FONASA and ISAPREs, respectively), including contributing beneficiaries, dependents of such contributors, and, in the public scheme, noncontributing beneficiaries (those financially unable to contribute).
The study was based on publicly available secondary data sources for measuring indicators in both health insurance subsystems. Sources included insurance administrative records and representative population-based surveys. Data were from 2013 or the closest year available. Monetary values were converted to US dollars using the average 2013 exchange rate (US$1 = 495 Chilean pesos).[22]
Variables and data sources Social and demographic context These variables were age structure, sex ratio, aging index (population aged ≥65 years per 100 persons aged <15 years), dependency ratio (population aged ≤14 years and ≥65 years in relation to population aged 15–64 years); rurality index, as defined by the Socioeconomic Characterization Survey (CASEN),[23] average monthly per capita income, income distribution (grouped from CASEN quintiles), population living below the poverty line (US$277 monthly for a single-person household), average educational level (years of schooling), and access to safe drinking water and sanitation. Sources were FONASA demographic statistics,[20] data requested from the Health Superintendency (HS) under the Transparency Law,[24] and CASEN 2013.[23]
Health insurance profile Number of noncontributing beneficiaries, number of contributing beneficiaries, number of dependents of contributing or salaried beneficiaries, number of contributing pensioners. Sources were HS[24] and FONASA.[20]
Performance indicators
Inputs
- Financial: average monthly funding (contributions and fiscal transfers) per capita, monthly per capita benefit expenditures, workers’ medical leave benefits (SIL) per contributing beneficiary. Sources were HS,[25] FONASA,[20] Budget Department of the Finance Ministry[26] and the Health Economics Department of the Ministry of Health (DESAL-MINSAL).
- Physical: hospital beds in SNSS facilities and private clinics, 2012. Sources were National Statistics Institute (INE) Statistical Yearbook[27] and Clínicas de Chile A.G.[28]
Outputs These were hospital discharge rate per 1000 population by cause; and outpatient utilization rate in the last three months, including general medicine and specialist office visits, urgent care, dental care, laboratory tests and imaging exams. Sources were CASEN[23] and the 2013 Hospital Discharges Data Base,[29] per ICD-10 (grouped according to Special Tabulation List for Morbidity),[30] for causes comprising >50% of discharges.
Outcomes Effective coverage by programs providing care for diabetics and people with hypertension (% of patients adequately treated out of the total number of people with the condition),[31] depression treatment coverage (patients treated out of the total number of people tested and diagnosed with depression), cervical cancer screening coverage (% of women aged 25–64 years tested in the last three years), breast cancer screening coverage (% of women aged ≥35 years who have had a mammogram in the last three years), and proportion of preventable hospitalizations caused by ambulatory care sensitive conditions, including asthma, diabetes and hypertension, out of a total of 20.[32] Sources were National Health Survey,[33] the Hospital Discharges Data Base,[29] and CASEN.[23]
Impact Health status. Prevalence of risk factors and chronic illness, such as sedentarism, obesity, dyslipidemias, metabolic syndrome, cardiovascular risk (high and very high, per ATPIII Update),[34] hypertension, diabetes, problem drinking (brief problem drinking scale >2),[35] chronic liver damage, symptoms of depression, cognitive decline in the elderly, chronic respiratory symptoms, hypothyroidism, sleep apnea, reduced kidney function, hearing loss, need for dental prosthetics, lifetime prevalence of fractures in people aged >20 years; quality of life, mental and physical health, according to Short Form Survey 12 (SF12).[36] SF12 mental and physical health scores were standardized on a scale of 1 to 100 (the higher the score, the better quality of life), median 50, SD 10. Sources were National Health Survey[33] and its definitions.[34]
Financial protection. Incidence of catastrophic health expenditures (percentage of households whose out-of-pocket health expenditures exceeded 30% of their ability to pay), incidence of impoverishment expenditures (percentage of households that fell below the poverty line due to out-of-pocket health expenditures) according to the DESAL-MINSAL out-of-pocket health expenditure study,[37] based on the 2012 Family Budget Survey,[38] which set the poverty line at the subsistence level[39] and ability to pay threshold at 30%.
User satisfaction. Four elements were queried: health system, health insurance plan, health centers, and information received from the health insurance plan. Each was rated on a scale of 1–7 (very unsatisfied to very satisfied), according to the 2015 HS User Opinion Study and a synthetic indicator, health system satisfaction, was created by weighting each of the elements and summarizing.[40]
Analysis To compare the two systems, we calculated 95% confidence intervals using SPSS 22. Risk factor and chronic disease prevalence (with confidence intervals) were calculated, using complex sample adjustment, and rates were age adjusted to the Chilean population structure using Epidat 3.1. Hospital discharge rates (with 95% confidence intervals) and discharge rate ratios (DRR) for ISAPREs vs. FONASA were calculated using OpenEpi 3.01.
Ethics The study used only secondary sources and published data, so was exempted from review by the Ethics Committee of Santiago’s Universidad del Desarrollo.
RESULTS
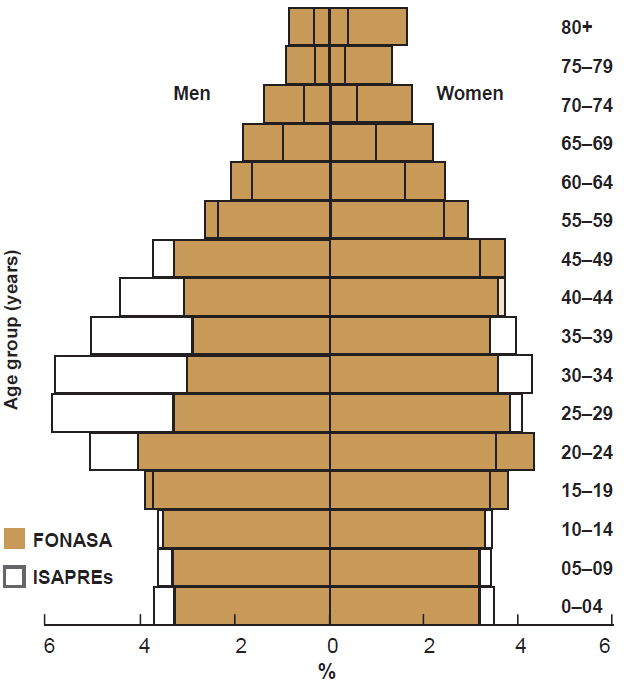
Demographic indicators and social determinants There were major differences between FONASA and ISAPREs in the demographic structure of their beneficiary populations. The population covered by ISAPREs was younger, with a higher proportion of working age men and a lower proportion of older adults, particularly women (Figure 1). ISAPREs’ sex ratio was 1.3 times that of FONASA (1.2 vs. 0.9), and FONASA’s aging index was more than double that of the ISAPREs (83.4 vs. 36.5).
Similarly, the ISAPRE population was less likely to be poor (1.5% below the poverty line vs. 17.2% for FONASA), was more educated (14.6 vs. 10 years of schooling) and less rural (2.8% vs. 14.8%), and had greater access to safe drinking water (99.8% vs. 97.9%) and improved sanitation facilities (99.8% vs. 96.6%). Monthly per capita income of ISAPRE beneficiaries was 3.3 times that of FONASA beneficiaries (US$1331.30 vs. US$407.80). All these differences were significant at the 5% level.
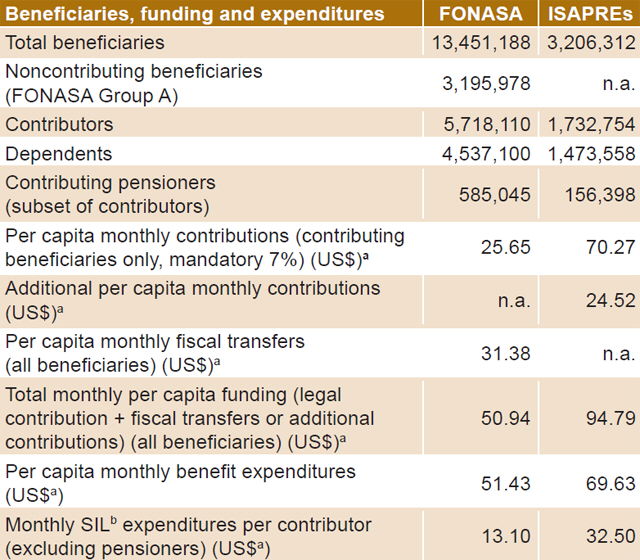
Inputs Table 1 displays information about financial inputs for FONASA and ISAPREs. Although the total number of paying FONASA beneficiaries (contributing beneficiaries plus their dependents) was 3.2 times the number of ISAPRE beneficiaries, total annual accumulated mandatory contributions collected by the public insurance program was only 1.16 times that collected by private insurance companies. Thus, the mandatory monthly per capita ISAPRE contribution was 2.7 times that of FONASA (US$70.27 vs. US$25.65). FONASA received complementary fiscal transfers, and contributing ISAPRE beneficiaries paid additional amounts. Thus, the total amount per beneficiary received by FONASA was US$50.94 per month, while ISAPREs collected US$94.79.
Benefit expenditures were also markedly different: US$51.43 per month per FONASA beneficiary and US$69.63 per ISAPRE beneficiary. On the other hand, the monthly expenditure on SIL per contributing beneficiary (excluding pensioners) was 2.5 times greater in ISAPREs than FONASA. Regarding physical inputs for both types of beneficiaries, 25,479 beds were available in SNSS facilities,[27] or 1.89 beds per 1000 FONASA beneficiaries, compared with 6292 beds in private clinics (with >10 beds; bed counts for smaller clinics are not published),[28] or 1.96 beds per 1000 ISAPRE beneficiaries.
Figure 1: Beneficiary age and sex distribution, FONASA and ISAPREs, 2013
FONASA: National Health Fund ISAPRE: health insurance institution Sources: FONASA[20] and Health Superintendency[24]
Table 1: Beneficiaries, funding and expenditures, FONASA and ISAPREs, 2013
a 2013 exchange rate; b financed by the Public Health Subsecretariat through compensation funds; ISAPREs fund SIL for their enrollees’. FONASA: National Health Fund ISAPRE: health insurance institution SIL: workers’ medical leave benefits (nonoccupational injury or disease) n.a.: not applicable Sources: FONASA,[20] Health Superintendency,[24,25] Ministry of Finance Budget Department,[26] MINSAL Health Economics Department
Figure 2: Beneficiary health service utilization, FONASA and ISAPREs, 2013

FONASA: National Health Fund ISAPREs: health insurance institutions
Source: CASEN 2013[23]
Outputs ISAPRE beneficiaries made greater use of services such as specialist visits, dental care, laboratory tests, imaging and hospitalization, which is compatible with higher expenditures per beneficiary (Table 1) and greater access to more complex services by people with private insurance coverage (Figure 2). In contrast, FONASA beneficiaries made greater use of emergency room visits and routine checkups. No significant differences were observed in use of general medicine or mental health services.
In 2013, ISAPRE beneficiaries had hospital discharge rates substantially higher than those of FONASA (96.6 and 89.9 per 1000 beneficiaries, respectively), with a discharge rate ratio (DRR of 1.075. Large differences by type of insurance were observed in principal cause of discharge (Figure 3). ISAPRE beneficiaries had significantly higher discharge rates for obesity (DRR = 12.1), migraine (DRR = 11.4), nasal disorders (DRR = 9.4) and dorsopathies (DRR = 4.38). FONASA had higher discharge rates for diabetes (DRR = 3.0), pneumonia (DRR = 2.2) and single spontaneous delivery (DRR = 1.96).
Outcomes ISAPREs had greater effective coverage than FONASA for mammogram and Papanicolaou screening (69.4% vs. 49.2% and 75.9% vs. 71.4%, respectively), both differences statistically significant at the 5% level.[23] The same occurred with coverage of depression (ISAPREs 82%, FONASA 56%) and effective coverage of diabetes (ISAPREs 42%, FONASA 34%). However, effective hypertension coverage was higher in FONASA (18% vs. 13% in the ISAPREs).[9] The proportion of preventable hospitalizations for ambulatory care sensitive conditions was higher in public insurance; 14% of FONASA discharges and 7.8% of ISAPRE discharges could have been avoided with better outpatient service readiness.
Impacts Analysis of beneficiaries’ age-adjusted health status showed a similar burden of disease in both groups, except for sleep apnea (FONASA 5.2%, ISAPREs 0.8%) and need for dental prosthetics (FONASA 30.6%, ISAPREs 9.2%), both greater in FONASA, and reduced kidney function and chronic liver disease, which were higher for ISAPRE beneficiaries (Figure 4).
The average normalized SF12 score for physical and mental dimensions of health-related quality of life was higher for ISAPRE beneficiaries, but the difference was statistically significant only for the physical dimension (52.99 vs. 49.35).
In terms of financial protection, FONASA beneficiaries had a higher incidence of catastrophic expenditures due to out-of-pocket health spending than ISAPRE beneficiaries (4.2% vs. 3.7%). The incidence of impoverishment due to out-of-pocket expenditures was null for ISAPRE beneficiaries and 0.6% for FONASA beneficiaries.
Figure 3: Hospital dischargesa by principal cause,b FONASA and ISAPREs, 2013

a2013 Hospital Discharge Database[29] bICD-10, grouped according to Special Tabulation List for Morbidity[30]
ccode for single cesarean delivery separated from code 242 for this analysis FONASA: National Health Fund ISAPRE: national health institution
Finally, the health system satisfaction index was 6 or 7 (satisfied or very satisfied) for 17% of FONASA beneficiaries and 37% of ISAPRE beneficiaries, and 1–4 (1 = very dissatisfied, 4 = neutral) for 43% of FONASA beneficiaries and 20% of ISAPRE beneficiaries.
DISCUSSION
The results show sharply contrasting realities. Public insurance serves primarily an elderly and low-and-middle income population with a higher proportion of women and a greater prevalence of risk factors and ill health. The higher burden of diseases such as diabetes and hypertension is determined by enrolment demographics, which could in turn reflect ISAPREs’ selection for lower risk (rather than greater effectiveness). Age-adjusted prevalence of chronic diseases was not significantly higher in FONASA than in ISAPRE beneficiaries. This might be related to a lack of incentives for long-term prevention among private insurers. In practice, private insurance companies can raise the costs of insurance plans as people get older (and risks increase) and can charge women more at any age.[19,41] This mechanism of unilateral increases (not requiring beneficiary approval) may lead to voluntary withdrawal, passing beneficiaries on to public insurance when they are no longer net contributors. Beneficiaries have responded by going to court to avoid increases.[42]
User satisfaction and financial protection received higher ratings by ISAPRE beneficiaries. However, financial protection results should be analyzed in light of ISAPRE beneficiaries’ higher incomes, which require higher absolute expenditures to reach catastrophic expenditure and poverty threshholds. On the other hand, previous publications based on out-of-pocket health care spending data show greater financial protection for FONASA beneficiaries,[13] and for beneficiaries in the lowest income quintiles.[43]
Figure 4: Age-adjusted prevalence of selected chronic conditions, FONASA and ISAPREs 2009–2010*

*Nation al Health Survey 2009–2010[33] EBBA: brief abnormal drinking scale[35]
FONASA: National Health Fund ISAPREs: health insurance institutions
In Latin America, more than in other developing regions, private health insurance plays a predominant role, whether complemented and supplemented by public insurance systems, or offering the same services as an alternative, as in Colombia and Chile.[44] So segmentation is not a characteristic exclusive to the Chilean health system, but also occurs in health systems in other Latin American countries with parallel subsystems.[44–48] During the second half of the 20th century, military dictatorships dominated the economic and political context in these countries, imposing cuts in public investment in social sectors, including health.[45] Such conditions fostered creation of other types of financial arrangements in the health sector, resulting in differential access to services.[47] Thus, with the exception of Brazil, Cuba and Costa Rica (which already had unified health systems by the 1990s), the governmental quest to provide health care coverage for the most impoverished has reinforced fragmentation in financing and service delivery, segregating social groups according to their socioeconomic or employment status.[45] This structural feature of our health systems has been a serious barrier to progress toward the goal of universal health coverage.
Nevertheless, private sector participation in social health insurance is not in itself a problem. There are examples of health systems in more developed countries, such as Switzerland and Holland, in which private insurance companies function with a social insurance logic.[49] In many countries, social insurance arrangements within health systems financing frameworks imply a solidarity approach to risk and funding, whether financed by general taxes or by a fund that distributes resources through a single insurance plan or several competing risk-adjusted insurance plans. In such systems, the higher incomes of some help resolve the greater health needs of others.
This does not occur in the Chilean health system context in which the greater resources of ISAPRE beneficiaries are designated to cover their lower risks, resulting, however, in higher service utilization. On the other hand, and despite major fiscal transfers, the per capita expenditure per FONASA beneficiary is considerably less with lower service utilization by a population with greater health needs.
In recent years, there have been several attempts at health system finance reform in Chile. Three commissions were formed and presented various structural proposals geared to aligning the logics of the two subsystems in an attempt to unify them.[19,50,51] However, as of May 2017, Congress had still not approved any legislation reflecting those proposals.
This study is limited by its use of different information sources. Data from the private sector are more recent than some available from public records and national surveys. We looked at the insured populations largely in terms of financing and resource utilization because insurers, whether public or private, do not publish epidemiologic analyses of their enrollees. We could not examine health impacts in terms of mortality, since neither death certificates nor administrative data on communicable diseases include information on insurance status. Another limitation was the dearth of publications for comparison addressing the coexistence of different types of health insurance and comparing their performance. Despite these limitations, the available information reveals discernible differences between the subsystems. This analysis provides pertinent background information supporting the need to modify the way Chile’s health system is financed.
CONCLUSIONS
Public and private health insurance performance in Chile is strongly affected by health system segmentation. Differences in the demographic composition of the two beneficiary populations suggest a problem of adverse selection. While private plans offer greater financial protection and receive higher user satisfaction ratings than the public plan, differences in financing impact availability and utilization of services, which are determined by ability to pay and not by health needs (as expected in a social security context). This suggests a structural problem in Chile’s health system because of lack of integration between its two subsystems. A definitive solution is needed, with an integrated health system in which incentives are aligned with social insurance objectives, as well as with satisfactory and equitable health outcomes, responsiveness, and financial protection for all beneficiaries.
ACKNOWLEDGMENTS
The authors thank MINSAL’s Health Economics Department for providing data.