INTRODUCTION
Cardiovascular disease (CVD) remains the main cause of death worldwide. In 2008, over 17 million people died from CVD (29% of all deaths); near 80% occurred in low- and middle-income countries (LMIC), often in people aged <60 years.[1,2] CVD deaths are mainly due to myocardial infarction, stroke, and cardiac failure, caused by one or more major CVD risk factors, including smoking, hypertension, hypercholesterolemia and diabetes.[1–5]
In 2008, Cuba was among the countries with moderate age-standardized death rates and disability-adjusted life years lost (DALYs) from CVD and stroke in both sexes.[1,5] In 2011 CVD was responsible for 33,755 deaths, 36.4% of all deaths, with a mortality rate of 306.9 per 100,000 population.[6]
CVD has markedly decreased in many developed countries in the last 30 years, through population-wide measures and risk-factor management.[1,2,7] Prevention of major CVDs, particularly myocardial infarction and stroke, has been advocated for several years through intervention targeting individuals with one or more major CVD risk factors.[2] This approach may leave patients at high risk of a cardiovascular event due to suboptimal control; for example, even with medication for risk factors such as high blood pressure or cholesterol, levels may remain high, and patients may be unaware of abnormal levels of one or more risk factors.[2]
For over a decade, total risk assessment and management (a risk assessment taking into account all known major risk factors)[8] has been recommended by cardiovascular prevention guides in most high-income countries, based on cardiovascular risk prediction scores or charts derived from various sources in those countries.[9–19] These risk prediction tools have been based on values of the following variables: age, gender, cigarette smoking, systolic blood pressure, total cholesterol alone or plus HDL cholesterol, and diabetes. They are generally developed using multivariate risk prediction equations derived from large prospective cohort studies or population-based observational risk-factor and outcome (myocardial infarction and stroke) data analyzed longitudinally. They require specific calibration to be used in other populations.[2,15,16] In 2008, Gaziano and D’Agostino both reported non-laboratory-based risk prediction charts and score sheets adding body mass index (BMI), instead of total and HDL cholesterol, to the other factors analyzed.[17,18]
In 2007, WHO and the International Society of Hypertension (ISH) released two sets of CVD risk prediction charts for each of the 14 WHO epidemiologic subregions: one for settings where blood cholesterol can be measured and the other for those where it cannot.[2,19,20] Both sets incorporate age, gender, smoking, blood pressure and diabetes. Both also use standardized data on risk factor prevalence and relative risk for heart attack and stroke from each of the 14 specific WHO epidemiologic subregions, from the Comparative Risk Assessment Project conducted by the WHO.[21] Absolute risk of cardiovascular event was determined by scaling individual relative risk to population incidence rates of major CVDs, estimated from the global burden of disease study.[2,22] These charts are based on multivariate risk prediction equations and were designed to enable cardiovascular risk assessment and prediction in LMIC populations of each WHO subregion.[2]
Physicians can use these charts to tailor treatment strategies based on patients’ predicted risk categories. In general, guidelines do not recommend the use of drugs for persons with CVD risk < 20%; rather, conservative management focusing on lifestyle interventions addressing smoking and alcohol use, diet and physical activity. Guidelines recommend drug therapy for persons with a CVD risk threshold ≥20%, if affordable to countries. Drug therapy (generic antihypertensives, diuretics and lipid-lowering medications) is also recommended for persons with persistent elevated blood pressure (≥160/100 mmHg) and/or total cholesterol ≥8 mmol/L, or based on the physician’s clinical judgment.[2,20]
CVD morbidity and mortality have progressively increased in LMICs.[1,2,23] A combination of population-wide lifestyle interventions and a total-risk approach targeting high-risk groups is required for cost-effective CVD prevention and control.[2,4,24] Many people are unaware of their risk status; opportunistic and other forms of screening by health care providers are therefore also potentially useful in addressing CVD risk.
Many low-resource settings, particularly in LMICs, have health centers without facilities for cholesterol testing but able to test urine and blood glucose to screen for diabetes.[25] Risk prediction tools that do not include cholesterol would be useful to providers in such settings for early detection of persons at high risk who require more specific diagnostic tests, avoiding unnecessary tests for those at low CVD risk. That is, these tools could enable better targeting of limited resources in such settings towards those who are at higher CVD risk.[2,17,18,20]
In 2011, WHO published a multicountry study using the WHO/ISH risk prediction charts with cholesterol to determine population distribution of total cardiovascular risk and compare the resulting projected costs of drug treatment in eight LMICs. Cuba was one of the participating countries.[19] In this study, we applied the WHO/ISH risk prediction charts for the WHO America A subregion (Canada, Cuba and USA)[7,20] with and without cholesterol to the same cross-sectional population sample in Havana, Cuba as in the WHO multicountry study.
The objectives of this study were to determine the distribution of CVD risk in a Cuban population, using the WHO/ISH risk prediction charts with and without cholesterol, and to assess the applicability of the risk prediction tool without cholesterol in a middle-income country, by evaluating concordance between the two approaches and comparing drug requirements resulting from each, at risk thresholds of ≥20% and ≥30%, and for the single-risk-factor approach.
METHODS
The study analyzed data from 1287 individuals in the Corynthia Polyclinic catchment area of Plaza Municipality, Havana, for the previously-mentioned WHO multicountry cross-sectional study. Detailed procedures for sampling, population recruitment and variable measurement, as well as forms used, have been published.[19,26]
The two sets of WHO/ISH risk prediction charts for Americas Region A, with and without cholesterol, were used to classify cardiovascular risk.[2,20] Both sets use age (40–49, 50–59, 60–69 and ≥70 years), sex (male, female), smoking (no, yes, ex-smoker <12 months), systolic blood pressure (<140 mmHg; 140–160 mmHg, 160–180 mmHg and ≥180 mmHg), and presence or absence of diabetes (defined by fasting blood glucose ≥7 mmol/L) to grade cardiovascular risk. The chart developed for settings where blood cholesterol can be measured also uses blood cholesterol (total cholesterol in five categories: <5 mmol/L, 5 to <6 mmol/L, 6 to <7 mmol/L, 7–<8 mmol/L and ≥8 mmol/L).
The charts provide evidence-based recommendations on specific preventive actions (behavioral or pharmacologic) to initiate and at what intensity, categorizing the population by risk of developing a fatal or nonfatal severe CVD event (acute myocardial infarction and/or stroke) in the next 10 years: <10%; 10–19.9%; 20–29.9%; 30–39.9%; and ≥40%.[2,19,20] In this study, we used four risk categories: low, <10%; moderate, 10–19.9%; high, 20–29.9%; and very high risk, ≥30%.
To estimate drug requirements for CVD prevention, we used WHO criteria and recommendations [2,20] as well as others from expert consensus processes in Europe and New Zealand.[10–13] Guidelines recommend drug therapy for people with a CVD risk threshold ≥30%, or ≥20% if affordable to countries. Because it is possible for someone to have a low total risk per the chart while still having high blood pressure or elevated cholesterol, we analyzed three variants: risk per the chart alone; chart risk plus high blood pressure; and chart risk plus elevated total cholesterol (for the chart that includes cholesterol).
Statistical analysis Epi Info version 3.3.2 for Windows (CDC, USA), Excel file 2003 (Microsoft) and IBM SPSS Statistics 21 were used for data entry, transfer and processing. We used the chi-square test for statistical significance with a threshold of p <0.05. For data analysis we used the method described in WHO guidelines.[2] Concordance between the two prediction charts was calculated for the different risk levels assuming the chart with cholesterol as reference (i.e., if CVD risk was classified higher without cholesterol, we described it as an overestimate; if lower, underestimate).
Ethics The study was approved by the research ethics committees of WHO, Cuba’s Ministry of Public Health and Cardiology and Cardiovascular Surgery Institute; written informed consent was obtained from all participants, who remained anonymous. If a life-threatening condition was detected in a participant, he or she was referred to a secondary or tertiary facility with the necessary resources to treat the condition.
RESULTS
A total of 1287 persons aged 40–80 years (85.8% of the selected sample) participated in the study, with a mean age of 54.9±9.9 years, 64.9% females; the largest age group in both sexes was 40–49 years (Table 1).
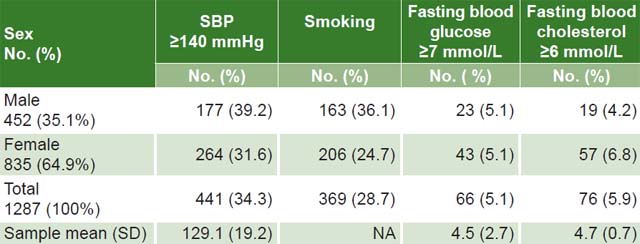
Table 2 displays CVD risk factor prevalence in participants. Systolic blood pressure ≥140 mmHg was the highest (34.3%), followed by smoking (28.7%), fasting blood glucose ≥7 mmol/L (5.1%) and fasting blood cholesterol ≥6 mmol/L (5.9%). Smoking and high blood pressure were higher among men, while fasting blood cholesterol was higher in women.
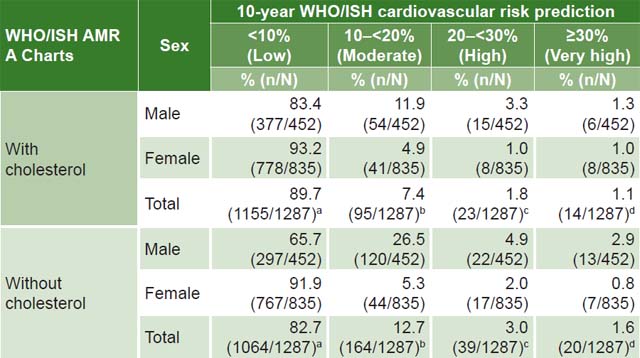
Table 3 shows the distribution of total CVD risk in this population, using both sets of the WHO/ISH CVD risk charts, with and without cholesterol. When risk assessment was done with cholesterol, 97.1% had a 10-year CVD risk of <20%; the corresponding proportion was 95.4% when cholesterol was not used; the proportions with risk ≥20% (high and very high) were 2.9% with cholesterol and 4.6% without. When we applied the charts without cholesterol, the percentage of the population in the high- and very-high risk categories (≥30%) was greater than with the chart using cholesterol (4.6% vs. 2.9%). Differences for the low- and moderate-risk categories were statistically significant. In general, the distribution of risk in the male population was toward higher risk with both tools.
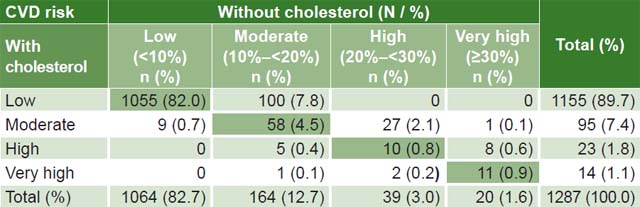
Concordance was found between the two charts for 1134 (88.1%) participants. Without information about cholesterol, CVD risk was overestimated in 136 (10.6%) and underestimated in 17 (1.3%). Of the 153 individuals with nonconcordant CVD risk estimates, 88.9% (136/153) were overestimates; 71.2% (109/153) belonged to low and moderate CVD risk categories that would not have drug intervention at a CVD risk threshold risk of ≥20% with either chart. Only 2.6% (34/1287) of the total sample was misclassified vis-á-vis need for drug intervention: risk was overestimated in 2.2% (28/1287) and underestimated in 0.5% (6/1287) (Table 4).
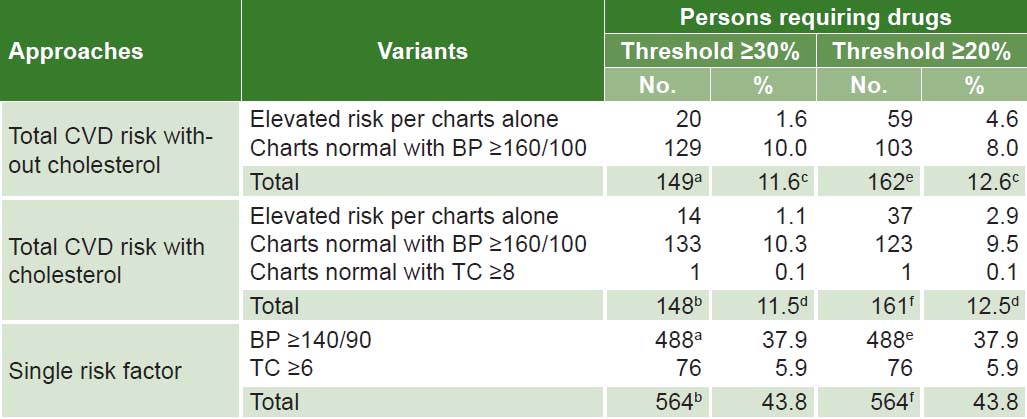
Using WHO guidelines for CVD risk assessment and management,[2] estimates of proportions of persons requiring medications to reduce CVD risk in this sample were similar for both charts. Using a threshold of ≥30%, 11.6% of those studied without measuring cholesterol were classified as requiring drugs, and 11.5% of those studied in whom cholesterol was measured; using a threshold of ≥20%, the respective proportions were 12.6% vs. 12.5%. Applying the single-risk-factor approach would classify 43.8% of the sample as requiring drug treatment (37.9% if cholesterol levels are not available), more than threefold the proportion with either risk chart (Table 5).
DISCUSSION
This study is one of the first to compare the use of a total CVD risk prediction tool with and without cholesterol for assessment and management of CVD risk in a middle-income country.
The large percentage of persons with low CVD risk and small percentage of people with high CVD risk in our sample using both charts (with and without cholesterol) is similar to the proportions observed by Mendis in eight LMICs (90%–98%),[19] by Ndindjock in Seychelles (94.9%),[27] and by Otgontuya in Mongolia (94.0).[28] In this study, the percentage of people with total cardiovascular risk <10% is higher than in developed countries (82%),[29,30] using the CVD risk tool with cholesterol. Although we found significant differences between estimates with and without cholesterol in the low- and moderate-risk groups, this was not so for the high-risk group, precisely the group for which drug therapy would be indicated. The basic purpose of these charts is to detect those at high risk who need immediate intervention; this was achieved in our study with a tool that did not include information about cholesterol.
Table 1: Sex and age distribution of study population

• Click image to enlarge •
SD: Standard deviation
Table 2: CVD risk factor prevalence by sex
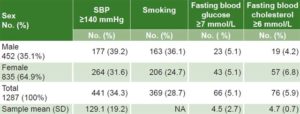
CVD: cardiovascular disease NA: not applicable SBP: systolic blood pressure SD: Standard deviation
Table 3: Ten-year total CVD risk prediction by sex, using WHO/ISH AMR A charts, with and without cholesterol
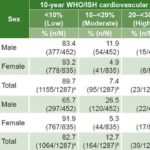
AMR A: Americas Region A (Canada, Cuba, USA) CVD: cardiovascular disease
ISH: International Society of Hypertension
aX2 = 24.46 p <0.001 bX2 = 19.85 p <0.001 cX2 = 3.719 p = 0.053 d X2 = 0.745 p = 0.388
Table 4: Concordance of WHO/ISH CVD risk charts with and without cholesterol
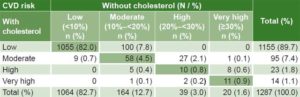
Concordance: 88.1% (1134/1287)
Nonconcordance: 11.9% (153/1287)
Overestimate: 10.6% (136/1287)
Underestimate: 1.3% (17/1287)
Misclassification for CVD risk threshold ≥20%: 2.6% (34/1287)
Overestimate: 2.2% (28/1287)
Underestimate: 0.5% (6/1287)
Table 5: Comparison of drug requirements for CVD prevention between total CVD risk assessment, with and without cholesterol, and single-risk-factor approach (n = 1287)
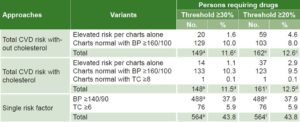
BP: blood pressure (mmHg) TC: total cholesterol (mmol/L)
a without cholesterol vs. single risk factor, threshold ≥30%: X2 = 238.3, p<0.005
b with cholesterol vs. single risk factor, threshold ≥30%: X2 = 334.3, p <0.005
c without cholesterol, threshold ≥30% vs. without cholesterol, threshold ≥20%: X2 = 0.527, p>0.05
d with cholesterol, threshold ≥30% vs. with cholesterol, threshold ≥20%: X2 = 0.521, p>0.05
e without cholesterol vs. single risk factor, threshold ≥20%: X2 = 217.4, p<0.005
f with cholesterol vs. single risk factor, threshold ≥20%: X2 = 310.3, p<0.005
Risk categories were concordant in 88.1% of the population, and among the nonconcordant, 10.6% were overestimated by the tool without cholesterol. Our percentage of concordance was higher than that reported by Green in Washington (USA) applying Framingham CVD risk scoring using cholesterol and/or BMI formulae; they found 78.2% concordance and 20.3% overestimation among the nonconcordant.[31]
Our findings that using the tool without cholesterol information would result in only 2.2% of the population receiving drugs due to overestimation and 0.5% not receiving them due to underestimation indicate that when we use the CVD tool without cholesterol, the risk of mistakenly leaving a needy patient without pharmacoprevention is quite small. At the same time, use of the tool would enable timely treatment for the vast majority of patients requiring drugs and appropriate recommendations to the majority of the population, optimizing use of scarce health system resources.
The reduction of the CVD risk threshold from ≥30% to ≥20% did not markedly increase drug requirements, while it increased capture of patients at risk, as the Mendis eight-country study also found.[19] It did not introduce overprescription of drugs, but resulted in better targeting of those more likely to develop CVD. In comparison, the single-risk-factor approach would more than triple drug usage.
Limitations of this study are its small sample size and the fact that the WHO/ISH charts have not yet been validated internationally; additional research is needed to do so for both charts, with and without cholesterol.[2,19] This study offers a baseline for a project to develop validated CVD risk charts for Cuba.
The study showed that a risk assessment tool not including cholesterol was able to identify individuals at high risk of CVD and thus enable immediate intervention; this is particularly important in settings where testing for cholesterol is unavailable or prohibitively expensive. These are the first results of the use of these tools in a limited sector of the Cuban population; similar studies in other population groups will be needed to corroborate these findings.
Furthermore, there are no country-specific cohort studies of CVD risk factors, morbidity and mortality in most low- and middle-income nations. Hence no validated or calibrated cardiovascular risk prediction charts have been developed for their populations. The two sets of WHO/ISH CVD risk prediction charts (with and without cholesterol) have been developed using specific standardized collection and assessment of data on risk factor prevalence and relative risk for myocardial infarction and stroke from each of the 14 specific WHO epidemiologic subregions.[20]
CONCLUSIONS
Use of a CVD risk tool excluding cholesterol would enable better targeting of those more likely to develop CVD without introducing excessive use of drugs for CVD prevention. The high percentage of people in low and moderate total-cardiovascular-risk categories in this study underlines the importance of complementing the high-risk strategy with a population-wide approach. In settings where cholesterol cannot be measured due to resource constraints, risk assessment for pharmacoprevention could be done using WHO/ISH charts that predict cardiovascular risk using age, sex, smoking status, systolic blood pressure and diabetes status.
ACKNOWLEDGMENTS
The authors thank the physicians and nurses of the ten family doctor-and-nurse offices of the Corynthia Polyclinic for their assistance in data collection.
- Global atlas on cardiovascular disease prevention and control. Geneva: World Health Organization; 2011 [cited 2013 Jan 11]. 155 p. Available from: http://www.paho.org/hq/index.php?option=com_docman&task=doc_view&gid=21049&Itemid=
- World Health Organization. Prevention of cardiovascular disease: Guidelines for assessment and management of cardiovascular risk [Internet]. Geneva: World Health Organization; 2007 [cited 2013 Jan 11]. 86 p. Available from: http://www.who.int/cardiovascular_diseases/guidelines/Prevention_of_Cardiovascular_Disease/en/index.html
- The world health report 2002: reducing risks, promoting healthy life. Geneva: World Health Organization; 2002.
- Preventing chronic diseases: a vital investment. Geneva: World Health Organization; 2005.
- World Health Organization. Global Health Observatory Data Repository. Mortality: Cardiovascular diseases and diabetes, deaths per 100,000 [Internet]. Geneva: World Health Organization; 2008 [cited 2013 Jan 11]; [about 1 screen]. Available from: http://apps.who.int/gho/data/?vid=2490#
- Ministry of Public Health (CU). Anuario Estadístico de Salud 2012 [Internet]. Havana: Ministry of Public Health (CU); 2013 [cited 2013 Jul 12]. Available from: http://files.sld.cu/dne/files/2013/04/anuario_2012.pdf. Spanish.
- Capewell S, O’Flaherty M. What explains declining coronary mortality? Lessons and warnings. Heart. 2008 Sep;94(9):1105–8.
- Grundy SM, Pasternak R, Greenland P, Smith S Jr, Fuster V. ACC scientific statement: Assessment of cardiovascular risk by use of multiple-risk-factor assessment equations: a statement for health care professionals from the American Heart Association and the American College of Cardiology. Circulation. 1999 Sep 28;100(13):1481–92.
- Wilson PW, D’Agostino RB, Levy D, Belanger AM, Silbershatz H, Kannel WB. Prediction of coronary heart disease using risk factor categories. Circulation. 1998 May 12;97(18):1837–47.
- Assmann G, Cullen P, Schulte H. Simple scoring scheme for calculating the risk of acute coronary events based on the 10-year follow-up of the prospective cardiovascular Munster (PROCAM) study. Circulation. 2002 Jan 22;105(3):310–5.
- Conroy RM, Pyörälä K, Fitzgerald AP, Sans S, Menotti A, De Backer G, et al. The SCORE project group. Estimation of ten-year risk of fatal cardiovascular disease in Europe: the SCORE project. Eur Heart J. 2003 Jun;24(11):987–1003.
- Williams B, Poulter NR, Brown MJ, Davis M, McInnes GT, Potter JF, et al. British Hypertension Society guidelines for hypertension management 2004 (BHS-IV): summary. BMJ. 2004 Mar 13;328(7440):634–40.
- Jackson R. Updated New Zealand cardiovascular risk-benefit prediction guide. BMJ. 2000 Mar 11;320(7236):709–10.
- Jones AF, Walker J, Jewkes C, Game FL, Bartlett WA, Marshall T, et al. Comparative accuracy of cardiovascular risk prediction methods in primary care patients. Heart. 2001 Jan;85(1):37–43.
- Marrugat J, D’Agostino R, Sullivan L, Elosua R, Wilson P, Ordovas J, et al. An adaptation of the Framingham coronary heart disease risk function to European Mediterranean areas. J Epidemiol Community Health. 2003 Aug;57(8):634–8.
- Liu J, Hong Y, D’Agostino RB Sr, Wu Z, Wang W, Sun J, et al. Predictive value for the Chinese population of the Framingham CHD risk assessment tool compared with the Chinese Multi-Provincial Cohort Study. JAMA. 2004 Jun;291(21):2591–9.
- Gaziano TA, Young CR, Fitzmaurice G, Atwood S, Gaziano JM. Laboratory-based versus non-laboratory-based method for assessment of cardiovascular disease risk: the NHANES I Follow-up Study cohort. Lancet. 2008 Mar 15;371(9616):923–31.
- D’Agostino RB Sr, Vasan RS, Pencina MJ, Wolf PA, Cobain M, Massaro JM, et al. General cardiovascular risk profile for use in primary care: the Framingham Heart Study. Circulation. 2008 Feb 12;117(6):743–53.
- Mendis S, Lindholm LH, Anderson SG, Alwan A, Koju R, Onwubere BJ, et al. Total cardiovascular risk approach to improve efficiency of cardiovascular prevention in resource constrained settings. J Clin Epidemiol. 2011 Dec;64(12):1451–62.
- World Health Organization. [Prevention of cardiovascular disease: Pocket guidelines for assessment and management of cardiovascular risk] [Internet]. Geneva: World Health Organization; 2008 [cited 2013 Jan 11]. Available from: http://www.who.int/publications/list/PocketGL_spanish.pdf. 33 p. Spanish.
- Ezzati M, Hoorn SV, Rodgers A, Lopez AD, Mathers CD, Murray CJ, et al. Estimates of global and regional potential health gains from reducing multiple major risk factors. Lancet. 2003 Jul 26;362(9380):271–80.
- Murray CJL, López AD, editors. Quantifying the burden of disease and injury attributable to ten major risk factors. In: The global burden of disease: a comprehensive assessment of mortality and disability from diseases, injuries and risk factors in 1990 and projected to 2020. Cambridge (US): Harvard School of Public Health; 1996 Aug. p. 295–324.
- World Health Organization. Global status report on non-communicable diseases 2010. Geneva: World Health Organization; 2010.
- Lim SS, Gaziano TA, Gakidou E, Reddy KS, Farzadfar F, Lozano R, et al. Prevention of cardiovascular disease in high-risk individuals in low-income and middle-income countries: health effects and costs. Lancet. 2007 Dec 15;370(9604):2054–62.
- Mendis S, Al Bashir I, Dissanayake L, Varghese C, Fadhil I, Marhe E, et al. Gaps in capacity in primary care in low resource settings for implementation of essential non-communicable disease interventions. Int J Hypertens. 2012;2012:584041.
- de la Noval R, Armas NB, de la Noval I, Fernández Y, Pupo HB, Dueñas A, et al. Estimación del riesgo cardiovascular global en una población del área de salud “Mártires del Corynthia”. La Habana, Cuba. Rev Cubana Cardiología Cirugía Cardiovasc. 2011;17(1):62–8. Spanish.
- Ndindjock R, Gedeon J, Mendis S, Paccaud F, Bovet P. Potential impact of single-risk-factor versus total risk management for the prevention of cardiovascular events in Seychelles. Bull World Health Organ. 2011 Apr 1;89(4):286–95.
- Otguntuya D, Oum S, Buckley BS, Bonita R. Assessment of total cardiovascular risk using WHO/ISH risk prediction charts in three low and middle income countries in Asia. BMC Public Health. 2013 Jun 5;13(1):539.
- Marma AK, Berry JD, Ning H, Persell SD, Lloyd-Jones DM. Distribution of 10-year and lifetime predicted risks for cardiovascular disease in US adults: findings from the National Health and Nutrition Examination Survey 2003 to 2006. Circ Cardiovasc Qual Outcomes. 2010 Jan;3(1):8–14.
- Sacco RL, Khatri M, Rundek T, Xu Q, Gardener H, Boden-Albala B, et al. Improving global vascular risk prediction with behavioral and anthropometric factors. The multiethnic NOMAS (Northern Manhattan Cohort Study). J Am Coll Cardiol. 2009 Dec 8;54(24):2303–11.
- Green BB, Anderson ML, Cook AJ, Catz S, Fishman PA, McClure JB, et al. Using body mass index data in the electronic health record to calculate cardiovascular risk. Am J Prev Med. 2012 Apr;42(4):342–7.
THE AUTHORS
Porfirio Nordet Cardona (Corresponding author: pnordet@hotmail.com), cardiologist with a master’s degree in epidemiology and statistics, formerly of Cardiovascular Disease Programme, WHO, Geneva, Switzerland.
Shanthi Mendis, internist, Noncommunicable Diseases and Mental Health Cluster, WHO, Geneva, Switzerland.
Alfredo Dueñas Herrera, cardiologist, Institute of Cardiology and Cardiovascular Surgery (ICCCV), Havana, Cuba.
Reinaldo de la Noval García, cardiologist, preventive cardiology department, ICCCV, Havana, Cuba.
Nurys Armas Rojas, epidemiologist, preventive cardiology department, ICCCV, Havana, Cuba.
Ismael L. de la Noval González, cardiologist, preventive cardiology department, ICCCV, Havana, Cuba.
Hilda Pupo Rodríguez, family physician. Director (in 2008), Corynthia Polyclinic, Plaza Municipality, Havana, Cuba.