INTRODUCTION Ferritin is the best biomarker for assessing iron deficiency, but ferritin concentrations increase with inflammation. Several adjustment methods have been proposed to account for inflammation’s effect on iron biomarker interpretation. The most recent and highly recommended method uses linear regression models, but more research is needed on other models that may better define iron status in children, particularly when distributions are heterogenous and in contexts where the effect of inflammation on ferritin is not linear.
OBJECTIVES Assess the utility and relevance of quadratic regression models and quantile quadratic regression models in adjusting ferritin concentration in the presence of inflammation.
METHODS We used data from children aged under five years, taken from Cuba’s national anemia and iron deficiency survey, which was carried out from 2015–2018 by the National Hygiene, Epidemiology and Microbiology Institute. We included data from 1375 children aged 6 to 59 months and collected ferritin concentrations and two biomarkers for inflammation: C-reactive protein and α-1 acid glycoprotein. Quadratic regression and quantile regression models were used to adjust for changes in ferritin concentration in the presence of inflammation.
RESULTS Unadjusted iron deficiency prevalence was 23% (316/1375). Inflammation-adjusted ferritin values increased iron-deficiency prevalence by 2.6–4.5 percentage points when quadratic regression correction model was used, and by 2.8–6.2 when quantile regression was used. The increase when using the quantile regression correction model was more pronounced and statistically significant when both inflammation biomarkers were considered, but adjusted prevalence was similar between the two correction methods when only one biomarker was analyzed.
CONCLUSIONS The use of quadratic regression and quantile quadratic regression models is a complementary strategy in adjusting ferritin for inflammation, and is preferable to standard regression analysis when the linear model’s basic assumptions are not met, or when it can be assumed that ferritin–inflammation relationships within a subpopulation may deviate from average trends.
KEYWORDS Alpha-1-acid glycoprotein, C-reactive protein, anemia, iron deficiency, ferritin, acute phase protein, Cuba
ABSTRACT INTRODUCTION Ferritin is the best biomarker for assessing iron deficiency, but ferritin concentrations increase with inflammation. Several adjustment methods have been proposed to account for inflammation’s effect on iron biomarker interpretation. The most recent and highly recommended method uses linear regression models, but more research is needed on other models that may better define iron status in children, particularly when distributions are heterogenous and in contexts where the effect of inflammation on ferritin is not linear.
OBJECTIVESAssess the utility and relevance of quadratic regression models and quantile quadratic regression models in adjusting ferritin concentration in the presence of inflammation.
METHODS We used data from children aged under five years, taken from Cuba’s national anemia and iron deficiency survey, which was carried out from 2015–2018 by the National Hygiene, Epidemiology and Microbiology Institute. We included data from 1375 children aged 6 to 59 months and collected ferritin concentrations and two biomarkers for inflammation: C-reactive protein and α-1 acid glycoprotein. Quadratic regression and quantile regression models were used to adjust for changes in ferritin concentration in the presence of inflammation.
RESULTSUnadjusted iron deficiency prevalence was 23% (316/1375). Inflammation-adjusted ferritin values increased iron-deficiency prevalence by 2.6–4.5 percentage points when quadratic regression correction model was used, and by 2.8–6.2 when quantile regression was used. The increase when using the quantile regression correction model was more pronounced and statistically significant when both inflammation biomarkers were considered, but adjusted prevalence was similar between the two correction methods when onlyone biomarker was analyzed.
CONCLUSIONS The use of quadratic regression and quantile quadratic regression models is a complementary strategy in adjusting ferritin for inflammation, and is preferable to standard regression analysis when the linear model’s basic assumptions are not met, or when it can be assumed that ferritin–inflammation relationships within a subpopulation may deviate from average trends.
KEYWORDS Alpha-1-acid glycoprotein, C-reactive protein, anemia, iron deficiency, ferritin, acute phase protein, Cuba
INTRODUCTION Interpreting iron indicators in the presence of inflammation is a topic of particular interest to public health.[1] Serum ferritin concentration is recognized by WHO as the best indicator of populations’ iron deficiency,[2] but inflammation can affect ferritin concentrations, as it is an acute phase protein (APP).[3] For this reason, WHO suggests accompanying ferritin measurements with measurements of other APPs to confirm the presence of inflammation.[1,2] Among the most widely-used inflammation biomarkers in clinical practice and nutrition research are C-reactive protein (CRP) and Alpha-1-acid glycoprotein (AGP).[4]
IMPORTANCE This study demonstrates the usefulness of two new approaches for correcting ferritin concentrations in the presence of inflammation, which would improve methods for evaluating iron deficiency in Cuban children aged under five years , and thus provide more reliable data on iron deficiency prevalence in the country.
Several approaches have been proposed which use APPs to adjust for inflammation’s effects on ferritin levels and other biomarkers,[5–8] but there is still no consensus as to a preferred method.[4] In addition to taking the advantages and limitations of each method into account, the choice of method must be weighed against the burden of infection in the country or region where it is applied.[9] Most studies have been conducted in low- to middle-income countries with moderate to high infection burdens.[10–15]
Cuba is a developing country considered to have a population with a low level of inflammation. The most recent study on iron deficiency in children aged under five years supports the hypothesis that ferritin concentrations change in magnitude according to the state of inflammatory processes in the first five years of life.[16]
Iron status in Cuban children aged under five years is modified in the presence of inflammation.[16] In Pita’s study,[16] the ferritin concentrations of 1375 children were adjusted for inflammation (measured by CRP and AGP), using four of the most well-known approaches in recent literature: a) higher ferritin cut-off point (>30 g/L); b) excluding subjects with inflammation (CRP >5 mg/L or AGP >1 g/L); c) CRP- or AGP-based arithmetic correction factors; and d) regression correction using the method proposed by the BRINDA group (Biomarkers Reflecting Inflammation and Nutritional Determinants of Anemia).[17] The significant disparity between unadjusted ferritin values and those adjusted by some of the above approaches underlines the importance of correcting for inflammation and the need to develop adequate tools to examine the validity of the methods used for correction. Regression correction (RC) is recommended,[7] but the need for continued investigation into other methods of adjusting ferritin concoentrations is emphasized.[18]
The RC approach is based on subtracting inflammation’s effects from observed ferritin concentrations. This approach is less subject to bias and allows for continuous correction of ferritin even for lower reference values for inflammation than those traditionally used.[19] However, it is based on the assumption of a linear effect of inflammation on iron deficiency indicators; in practice, relationships between iron status biomarkers and APPs (CRP and AGP) are not linear.[4] Additionally, different types of relationships could exist for subpopulations that deviate from average trends for heterogenous distributions. It may therefore be necessary to use more flexible regression models, like quadratic regression models[20] and quantile regression models.[21–24]
Quantile regression (QR) is considered a natural extension of the standard regression model and allows for separate regression models to be used for different parts of the dependent variable’s distribution. QR’s additional flexibility may broaden the description of inflammation’s effect on ferritin’s conditional distribution. An additional advantage to QR is that it does not depend on normality assumptions or transformations.
Some exogenous factors—such as observations below detection limits—can alter parameters of the dependent variable’s conditional distribution. It is common practice to fill in undetected or censored data with a value equal to or less than the detection limit. However, when there are a considerable number of such replacements, estimates of mean effects and standard errors of least-squares regression models will not be reliable, risking erroneous conclusions. QR is more robust against these types of outliers. Therefore, QR models could be used to not only detect heterogenous CRP and AGP effects at different quantiles of ferritin values, but also to obtain more precise estimates compared to mean regression when normality assumptions are breached, or when there are outliers and long tails.[24]
Taking into account the need for more robust adjustment models that offer more precise measurements, we set out to estimate possible non-linear relationships and the usefulness and relevance of quadratic regression and quadratic regression by quantile models to explain ferritin concentration’s relationship with CRP and AGP inflammation biomarkers in Cuban children aged under five years.
METHODS Population, study area and variables We used data pertaining to population, study area and variables obtained from Cuba’s national anemia and iron deficiency survey, a cross-sectional study carried out by the National Hygiene, Epidemiology and Microbiology Institute (INHEM), from February through April each year from 2015–2018 in four randomly-selected regions of the country. The sample included 1375 presumably healthy children, with no diagnosis of chronic disease, aged 6 to 59 months, and complete serum ferritin, CRP and AGP records. A detailed description of sample selection can be found in the aforementioned article by Pita.[16]
Case definition Iron deficiency was defined as ferritin concentration <12 μg/L, the cut-off point recommended by WHO.[2] Acute inflammation was defined as CRP ≥5 mg/L and chronic inflammation as AGP >1 g/L.[2]
Statistical analysis Graphs and simple statistics were used to study the distribution of the three biochemical variables. All showed some kind of positive skew and were transformed to their natural logarithms to avoid disproportionate ranges. Once data was transformed, histograms and normal probability plots were constructed to visually judge normality.
To explore the relationship between ferritin and inflammatory biomarkers, children in the sample were divided into 10 subgroups, determined by intervals of equal length, according to ln(CRP) or ln(AGP) values. Box-and-whisker plots were constructed to observe ferritin concentration patterns in the different ranges of each inflammation biomarker.
APP’s effect on ferritin was evaluated using models on a continuous scale. We used linear regression, quadratic regression (Rc) and quantile quadratic regression (QRc). Models were adjusted considering each biomarker’s effect (CRP and AGP) both separately and jointly. We constructed scatterplots to show bivariate associations.
To interpret iron stores in the presence of inflammation, ferritin concentrations were adjusted using two approaches: quadratic regression correction (RcC) and quantile quadratic regression correction (QRcC).
These analyses were conducted using the statistical software R, version 3.5.3 (Free Software Foundation, USA).[25] The Im function of the Stats statistical package was used to fit models with the least squares method. Model fit by quantiles was performed using the rq function of the quantreg package.[26]
Estimation of quantile regression’s effects While ordinary least squares regression (OLS) offers only information on the conditional mean, QR allows us to estimate conditional quantiles θ of a response variable’s distribution based on a set of p predictor variables.
Analogous to linear regression, where , the QR model for a conditional quantile can be formulated as:
where 0 < θ < 1 and denote the conditional quantile function for the θ‒θth quantile. is the response vector , is the explanatory variable matrix and is the vector for unknown parameters for the generic conditional quantile θ .
Unlike OLS regression, in which a single regression line is fitted, QR has multiple lines, and therefore, as many coefficient vectors as quantiles are considered.
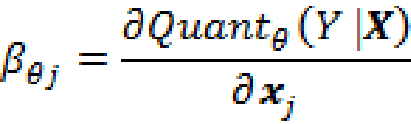
Parameter estimates in linear QR models are interpreted in the same way as any other linear model. Therefore—as in the OLS model—in the case of a multivariate QR with p explanatory variables, the QR model coefficient can be interpreted as the rate of change of the θth quantile of the dependent variable distribution by unit change in the jth regressor:
A median regression ( θ = 0.5) of ferritin concentrations on inflammation biomarkers specifies changes in median ferritin concentration as a function of predictors. Indicators’ effects on median ferritin concentration can be compared with their effects on other ferritin quantiles. As we increase from 0 to 1, we can determine the full distribution of , conditional on .
Quantile regression correction Suppose that we have data , and that the parameter of interest is the conditional quantile θ of , given by . Pairs are assumed to be observations of randomly-selected individuals from a population.
While the effects of CRP and AGP are uniquely calculated in linear regression, in quantile regression they vary depending on the desired quantile. It is possible to identify for each individual the QR model that can best predict the response variable to provide a unique vector of coefficients.[23]
Consider the QR model for a given conditional quantile θ :
The generic element of matrix is the dependent variable’s estimate corresponding to the ith individual according to the θth quantile.
The best estimate for each individual is the one that minimizes the difference between observed and estimated values for each of the k models:[23]
(1)
Once θi is identified for each individual i, ferritin concentrations are adjusted by subtracting the estimated effects of inflammation on the corresponding quantile assigned to each individual.
Take, as an example, the measurements of ln(ferritin) and ln(CRP) of the random sample of Cuban children aged under five years. The quantile quadratic model used to evaluate the effect of each inflammation biomarker on different parts of ferritin’s conditional distribution is expressed as follows:
(2)
where is the intercept and and are the regression coefficients of the θth quantile.
For all QR models formulated in this research, five conditional quantiles ( θ = 0.10, 0.25, 0.50, 0.75, 0.90) were used for synthesis purposes.
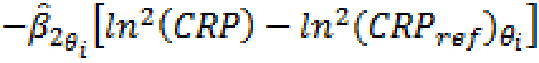
The graphs of each quadratic quantile function are parabolas in the form of υ, so the vertex is their lowest point. In this study, a threshold for inflammation was defined as the point at which the quadratic quantile function was minimized. This occurs when:
Where and are the estimates of the regression coefficients of each quantile function in (2). Once identified θi for each individual according to the criteria in (1), ferritin concentrations were adjusted by performing the following transformation:
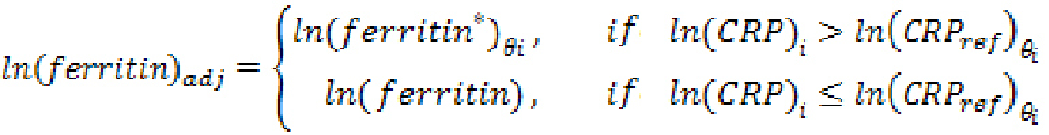
To avoid overfitting, the correction was applied according to the following expression:
The adj subscript refers to the ferritin concentrations’ fitted values. The ref subscript refers to inflammation reference values, under the assumption that they mark the cutoff points of inflammation biomarkers, from which ferritin concentrations increase.
Results on the values of inflammation-adjusted ferritin concentrations were expressed in the original measurement scale. Iron deficiency was determined by applying a ferritin cut-off of <12µg/L[2] to inflammation-corrected ferritin concentrations.
Ethics This research was approved by INHEM’s research ethics committee, and that of the Cybernetics, Mathematics and Physics Institute. Information was kept confidential, without revealing the childrens’ identity.
RESULTS Participant characteristics After an exploratory analysis, 10 children with extreme values were excluded from the study: 3 with CRP values >76 mg/L, and 7 with AGP values ≤0.012 g/L. The sample was thus comprised of 1365 children. Sample distribution by age and sex was as follows: 36.3% (496/1365) <2 years; 63.7% (869/1365) ≥2 years; 50.4% (688/1365) boys; 49.6% (677/1365) girls.
Iron deficiency prevalence (ferritin <12 µg/L) was 23.2% (317/1365). The prevalence of acute inflammation (CRP ≥5 mg/L) was 11% (150/1365) and that of chronic inflammation (AGP >1 g/L) was 30.8% (420/1365).
Ferritin concentrations changed when considered together with CRP and AGP values that were above or below the cutoff points established to define inflammation. Median ferritin concentration in children CRP-measured inflammation was 46.3 μg/L (Q1 = 20.8, Q3 = 64.1) and that in children without inflammation was 24.0 µg/L (Q1 = 12.2, Q3 = 47.5). Median ferritin concentration of AGP-measured inflammation was 34.5 µg/L (Q1 = 17.1, Q3 = 53.65) and that of children without inflammation was 23.0 µg/L (Q1 = 11.7, Q3 = 44.3).
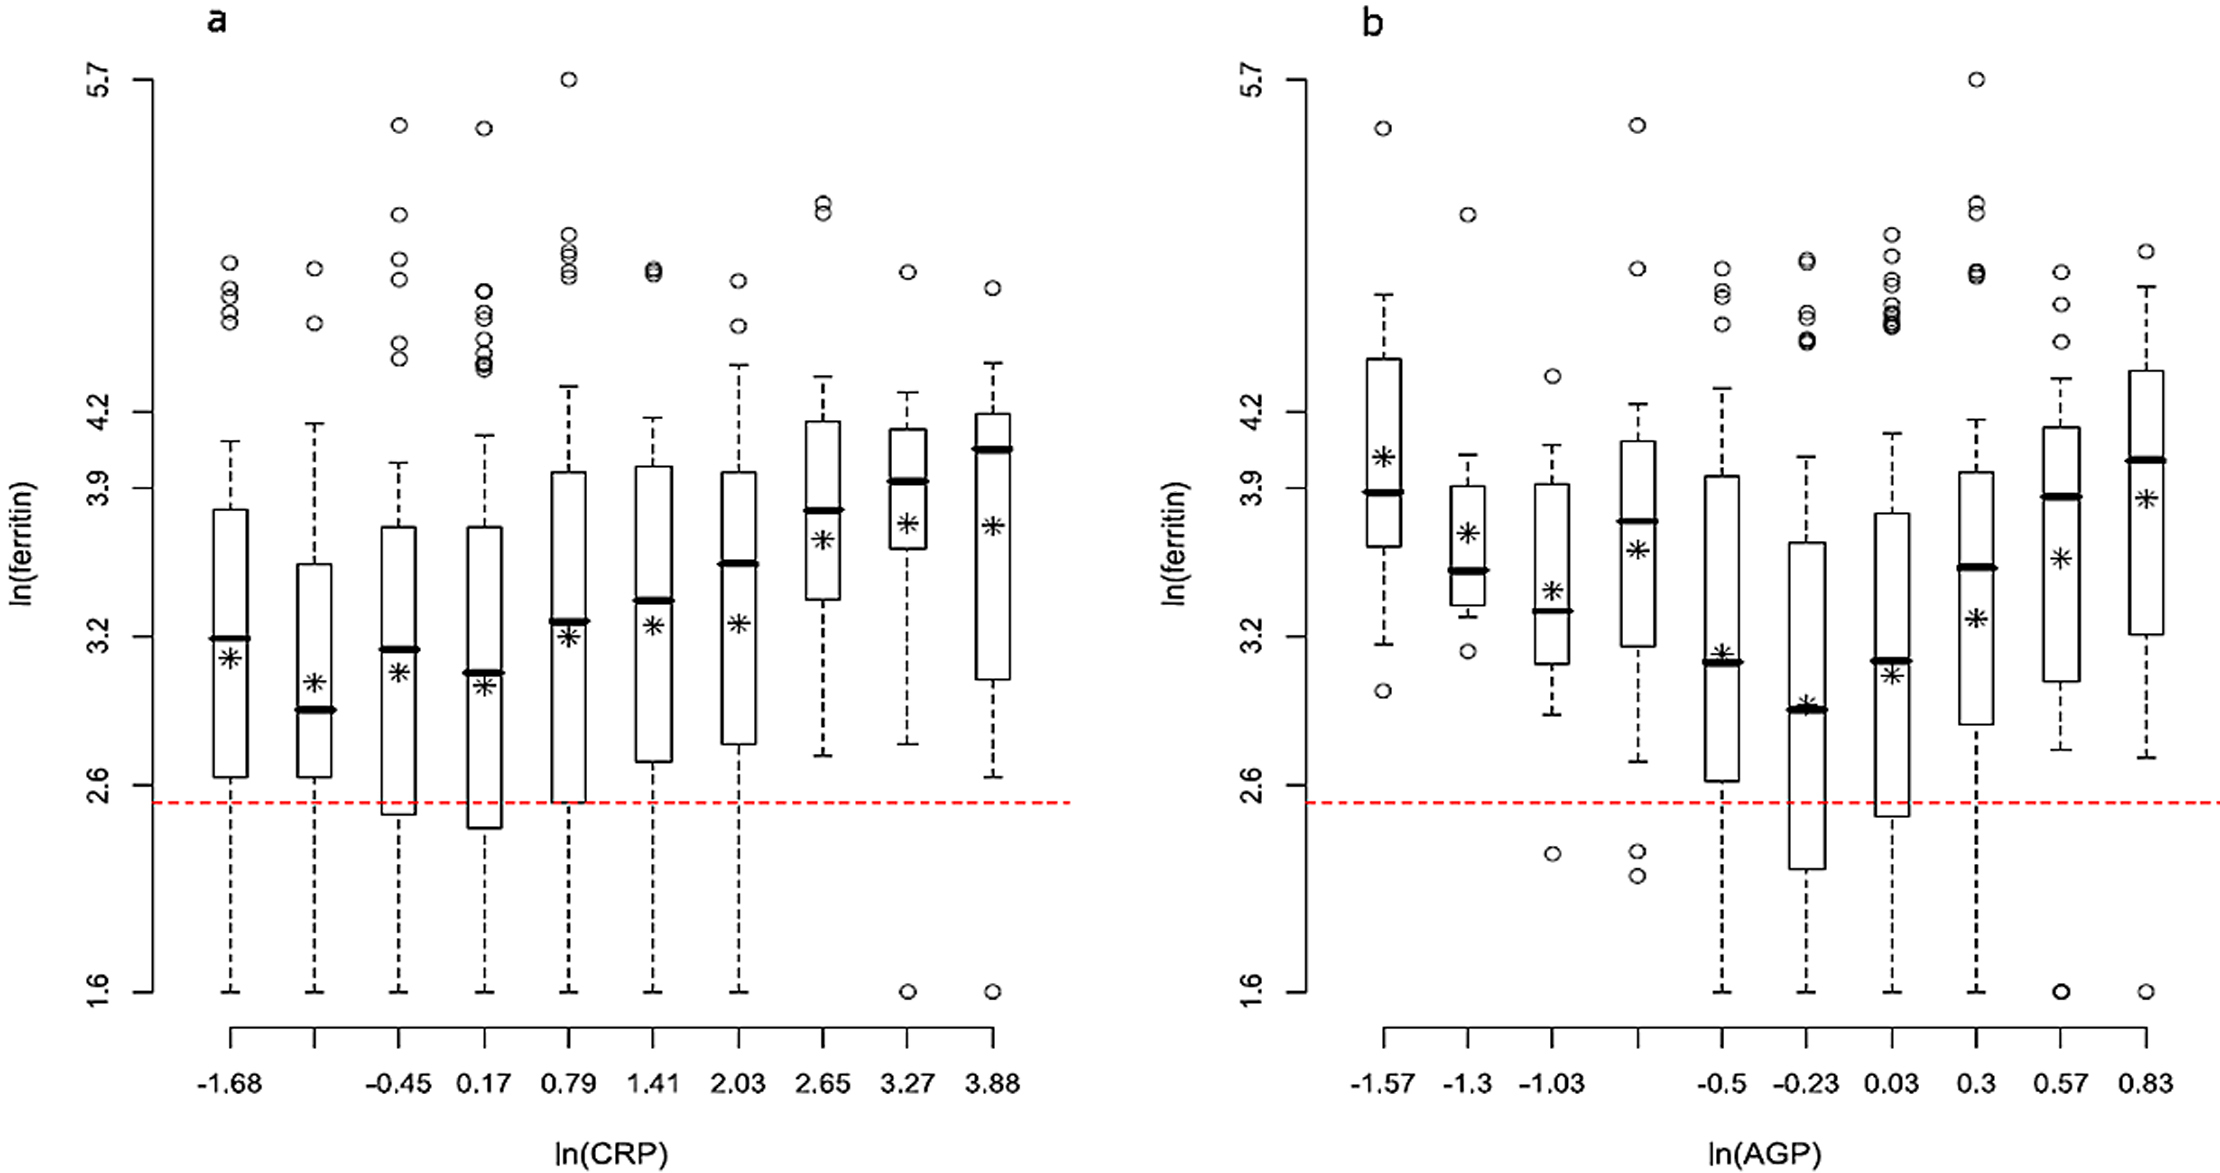
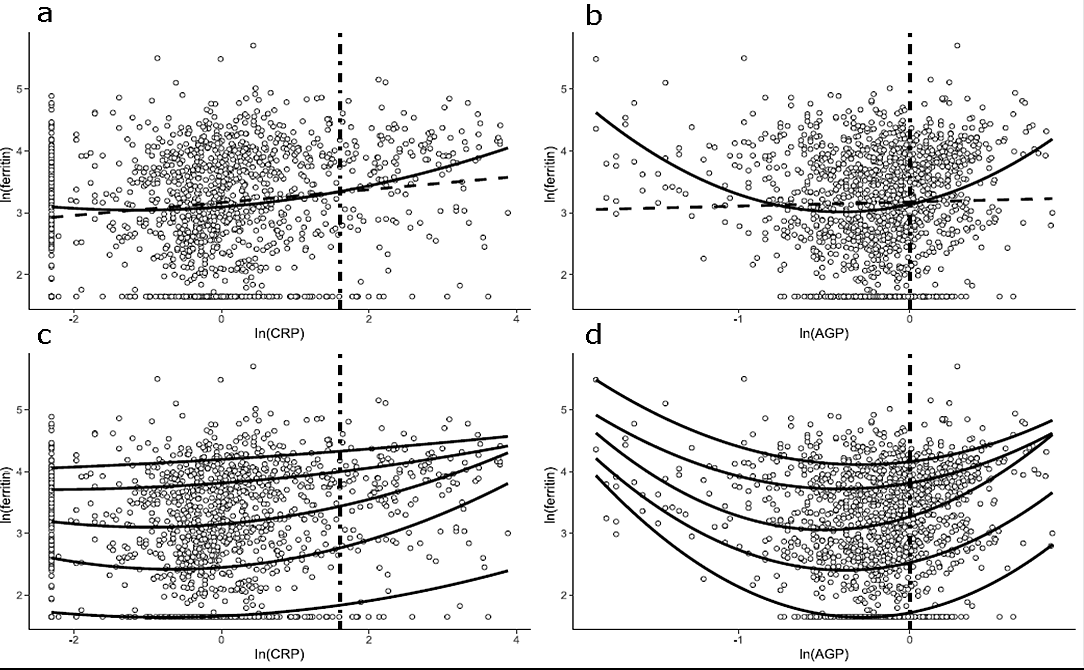
Relationship between inflammation and iron deficiency Figure 1 shows the means and the 0.10, 0.25, 0.50, 0.75 and 0.90 quantiles of ln(ferritin) in each subgroup, of the variables ln(CRP) and ln(AGP), respectively.
The distribution of ln(ferritin) conditioned to ln(CRP) is similar in the first subgroups, but as the magnitude of inflammation increases, the distribution of ln(ferritin) shifts toward higher values. Moreover, this variability does not seem to be constant (Figure 1a). Figure 1b shows a non-linear pattern in which ferritin concentrations are low when inflammation is moderate, and are high, for both high and low ln(AGP) values.
AGP: Alpha-1-acid glycoprotein; CRP: C-Reactive protein
The mean of ln(ferritin) in each subgroup is represented by asterisks,
while the median is represented by the line that cuts the box delimited by the first and third quartiles.
The extremes represent the symmetrical quartiles 0.10 and 0.90. The dashed horizontal red line represents the cut-off point for iron deficiency (ferritin <12 µg/L).
The values indicated on the vertical axis correspond to the values of the quantiles 0.10, 0.25, 0.50, 0.75 and 0.90 of the variable ln(ferritin) for the entire sample. The values on the horizontal axis correspond to the upper limits of the intervals defined by the subgroups.
Figure 1: ln(ferritin) concentration distributions in each subgroup according to: (a) ln(CRP) and (b) ln(AGP)
Effects of CRP and AGP on ferritin estimation In univariate linear regression models, the effect of ln(CRP) on ln(ferritin) was significant (0.105, p <0.000), suggesting that on average, when CRP values increase, ferritin concentrations also increase, but mean ln(ferritin) concentrations did not change significantly (0.066; p = 0.298) with increasing ln(AGP). When both inflammation biomarkers were included in a model, both effects were significant. The estimated effect of ln(CRP) was positive (0.128, p = 0.021), but the effect of ln(AGP) was negative (‒0.162, p = 0.025).
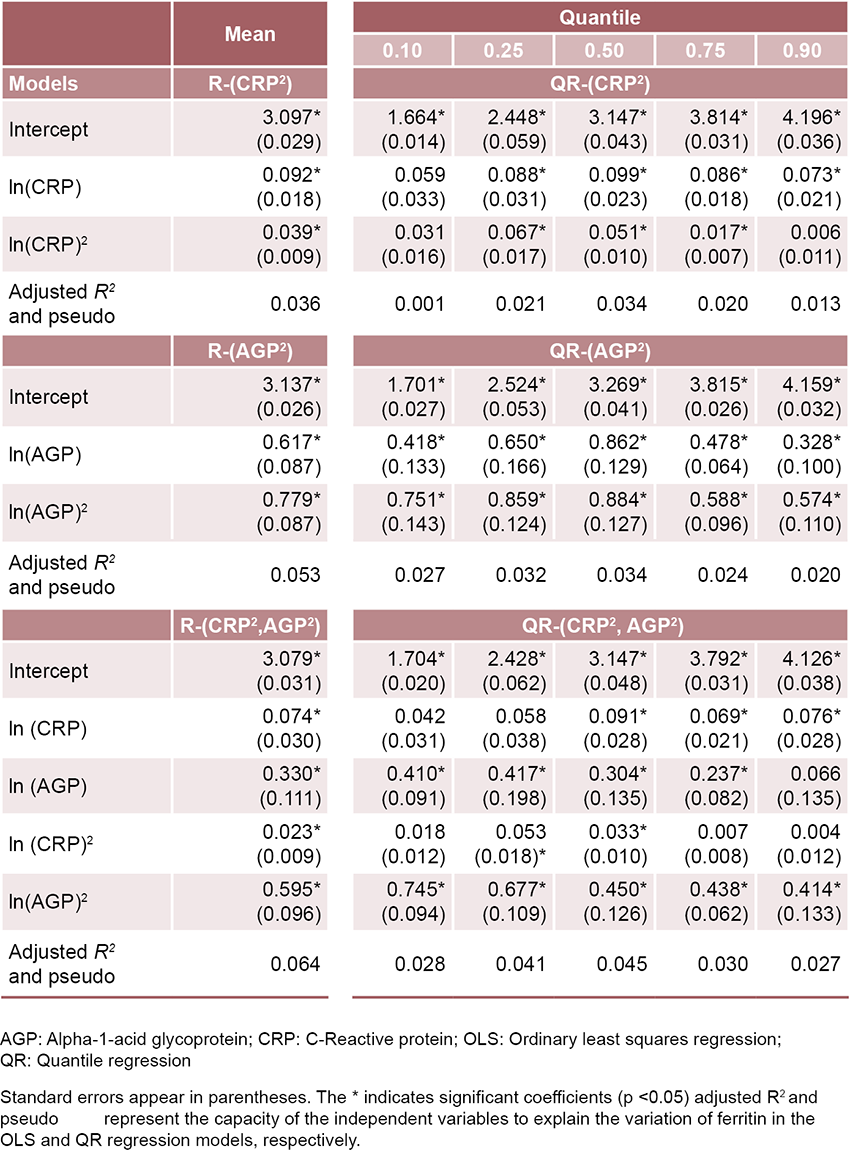
Graphs were used to find inconsistencies as per assumptions of models’ normality, linearity and homoscedasticity. Using information from Figure 1 as a guide, we evaluated quadratic functions in order to achieve a better fit. For illustrative and comparative purposes, Figure 2 shows two graphs that represent the linear and quadratic regression functions for each of the univariate models.
The minimum value of the nonlinear function is reached when ln(CRP) is ‒1.182, so the CRP value from which inflammation begins to positively influence ferritin values is 0.31 mg/L (Figure 2a), but it is nearly impossible to visually discriminate ferritin values below the vertex of the quadratic function. Inside the range of CRP values defined by the segment where linear and quadratic functions intersect, the fit of the two functions is similar, and ferritin concentrations increase more rapidly as inflammation increases.
AGP: Alpha-1-acid glycoprotein; CRP: C-Reactive protein
Gray dots represent the concentrations of the iron deficiency biomarker (ferritin).
In graphs (a) and (b) the dashed line is the linear regression line and the solid line represents the quadratic function fitted to the data. In figures (c) and (d) the curves represent the quadratic functions, by quantile. The vertical dashed line indicates the WHO-recommended cut-off point defining inflammation (5 mg/L for CRP and 1 g/L for AGP).
Figure 2: Linear and quadratic relationships between: (a) ln(CRP) and ln(ferritin); (b) ln(AGP) and ln(ferritin). Quadratic relationship by the following quantiles: (θ = 0.1; 0.25; 0.50; 0.75; 0.9) between (c) ln(CRP) and ln(ferritin); (d) ln(AGP) and ln(ferritin)
The quadratic model (Figure 2b) shows a U-shaped relationship between ln(ferritin) and ln(AGP), with the vertex at ln(AGP) of ‒0.397. Thus, inflammation begins to positively influence ferritin from AGP = 0.67 g/L. On average, ferritin concentrations tend to rise in individuals with high AGP values.
Table 1 shows the estimates of the quadratic regression models (Rc) for the conditional means of the combined and individual inflammation biomarkers: Rc-(CRP), Rc-(AGP) and Rc-(CRP, AGP). Estimated coefficients were significant (p <0.05). Adjusted R2 values were small, but higher than those obtained using linear models. Due to the high heterogeneity of the data, the quadratic models can only explain a small portion of ln(ferritin)’s variation around the mean. Associations explaining ferritin’s relationship to CRP values may be different in other parts of the conditional ferritin distribution.
Quantile regression feasibility and adequacy Quantile regression shows variation between ln(ferritin)’s quantile distribution. In different parts of the distribution, proposed models show an inflammation–iron deficiency relationship, which, as expected, was not linear and was identified in regression to the mean. Table 1 shows estimated coefficients for the 0.10, 0.25, 0.50, 0.75 and 0.90 quantiles of three models: QRc, QRc-(CRP), QRc-(AGP) and QRc-(CRP, AGP).
Quadratic regression models Rc-(CRP) and QRc-(AGP) showed a significant parabolic correlation (p <0.05) between ferritin concentrations and inflammation. In the case of the QRc-(AGP) model, estimated coefficients in all quantiles differ significantly from zero. In the QRc-(CRP), the coefficients associated with the linear ln(CRP) at the 0.10 quantile and the quadratic ln2(AGP) at the 0.90 quantile were not significant. As in the case of regression to the mean, the QRc models confirm that the relationship between ferritin and both inflammation biomarkers is not completely linear.
The graphic versions of the quadratic fits of the estimated conditional quantiles in Table 1 (models 4 and 5) can be seen in Figures 2c and 2d.
Inflammation’s effect on ferritin seems to be accentuated as CRP values increase (Figure 2c), as seen in children in the 0.25 and 0.50 percentiles. In the two highest quantiles, ferritin values also increased due to the effect of inflammation; but the increase is discrete and almost linear.
Figure 2d shows a positive increase of ferritin from each quantile function’s vertex. As AGP values increase, the effect of inflammation decreased toward the tail’s upper distribution (0.75 and 0.90 percentiles).
When both inflammation biomarkers were considered in the Rc-(CRP, AGP) quadratic regression model, all estimated coefficients showed a statistically significant positive effect, with non-linear ferritin growth (Table 1).
Table 1: Parameter estimates (and standard errors) of quadratic OLS and quantile regression models for ln(ferritin)
Estimation by quantiles in the QRc-(CRP, AGP) model suggests a more complex situation (Table 1), since the influence of explanatory variables on ferritin varied from one quantile to another, and some were significant in only some quantiles. The ln(CRP)’s effect was only statistically significant in the subpopulation of children who had the highest iron reserves. The ln2(AGP) variable is the most important in explaining ferritin’s variation throughout the conditional distribution.
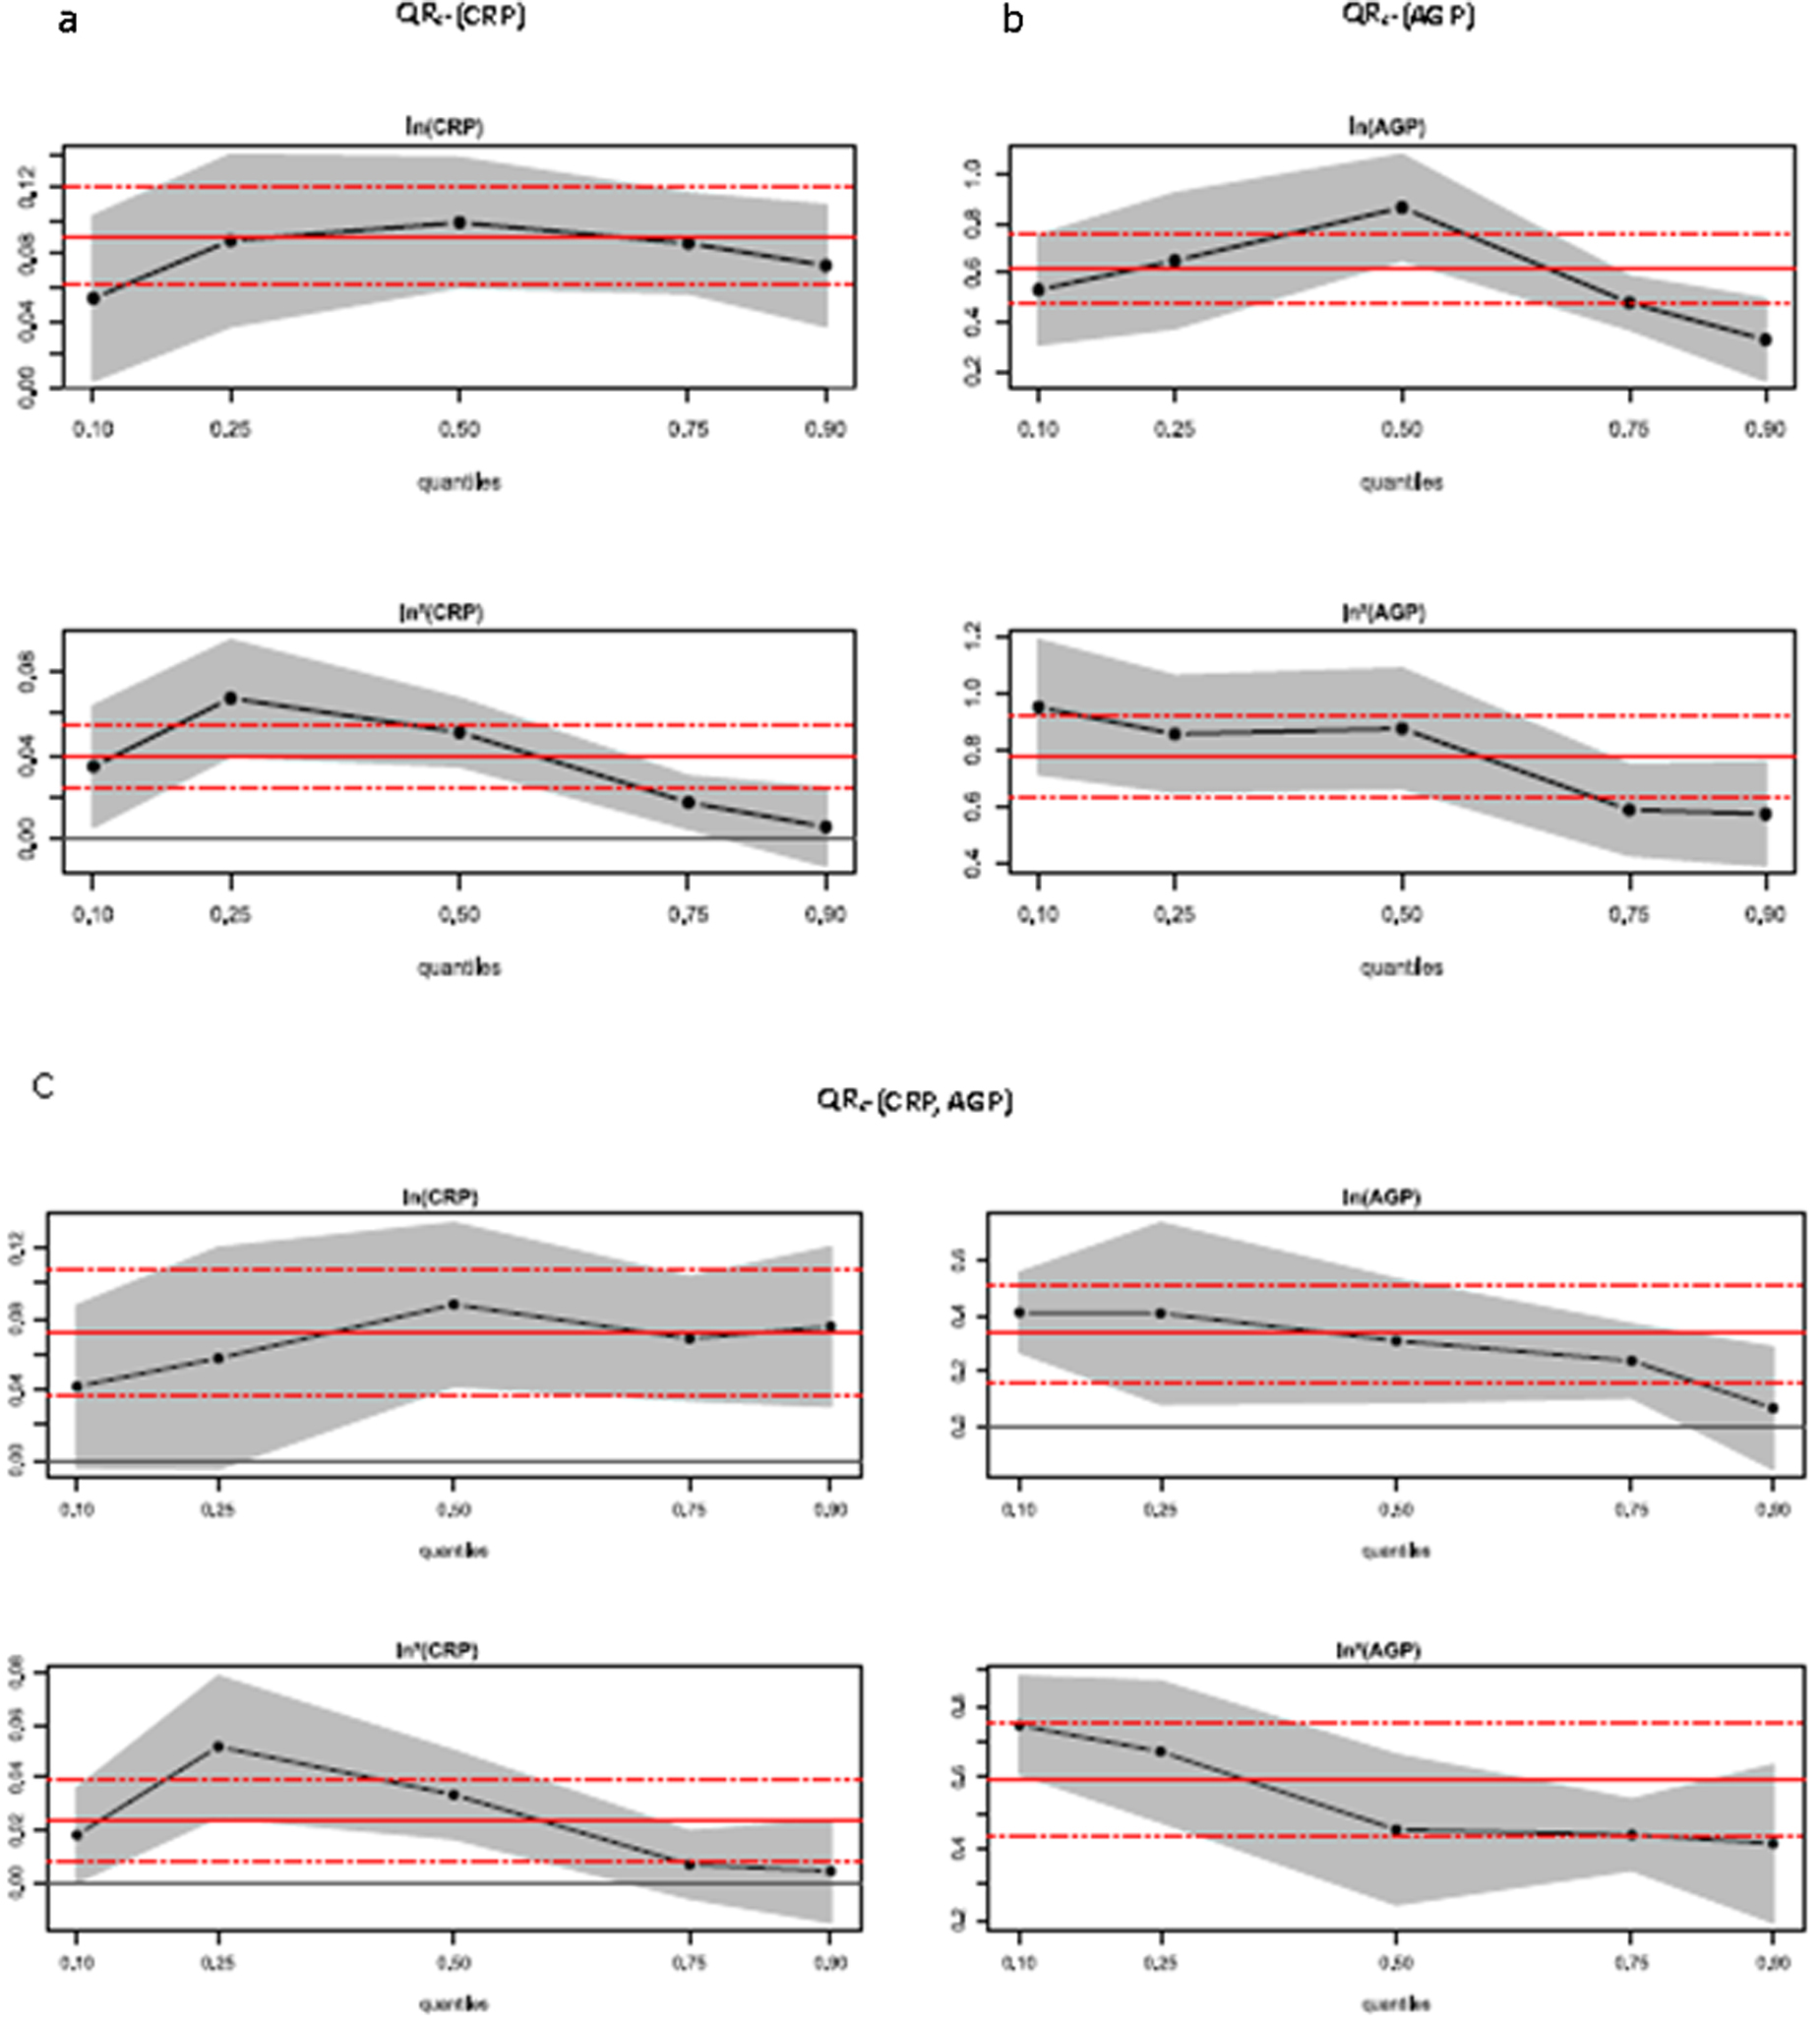
Statistical significance of OLS and QR estimate difference Within the 0.25 to 0.90 quantiles of the QRc-(CRP) model, estimates of ln(CRP)’s effects are within the estimation interval of the OLS regression (Figure 3a), which indicates that in this part of ferritin’s conditional distribution, the linear relationships identified by QRc are the same as those suggested by classical regression. However, the effect of ln2(CRP) at the 0.25 quantile is significantly higher than the OLS estimate, suggesting that in this part of the distribution, CRP’s quadratic effect is higher than the OLS estimate.
Figure 3b shows that the estimates of the effect of ln(AGP) in the QRc-(AGP) model is significantly higher at the 0.50 quantile of the distribution when compared to the mean estimate, indicating that around the median of the conditional distribution of ferritin, the linear effect of AGP could be greater than that estimated by regression to the mean.
The estimates of the linear effects of the two inflammation biomarkers on ln(ferritin) at almost all quantiles in the QRc-(CRP, AGP) model are within or very close to the OLS estimate’s confidence interval limits (Figure 3c), while the effect of ln2(CRP) at the 0.25th percentile is significantly larger than the estimate for the mean, confirming that CRP’s quadratic effect is larger than that estimated by classical regression in this part of the distribution.
AGP: Alpha-1-acid glycoprotein; CRP: C-Reactive protein; OLS: Ordinary least squares regression; QR: Quantile regression
The x-axis represents the different conditional quantiles. In each panel, the horizontal red lines represent the point estimate (solid line) and the 95% confidence interval (dashed lines) of the OLS regression coefficients. Black dots interconnected by solid lines represent point estimates of the QR coefficients. The gray area shows the 95% confidence intervals.
Figure 3: Regression coefficients estimated by OLS and QR
Statistical significance of differences between estimated coefficients at conditional quantiles The analyses of greatest interest focused on the 0.10, 0.25, and 0.50 quantiles, where adjusting for the effect of inflammation on ferritin concentrations was most likely to produce a change in iron deficiency prevalence, since they represent the subpopulation of children with ferritin concentrations around the WHO-recommended cut-off point defining iron deficiency.
The effects of CRP (both linear and quadratic) are similar across quantiles in the QRc-(CRP) model. The coefficient equality test[27] shows that there are no statistically significant differences between estimated values in the 0.10, 0.25 and 0.50 quantiles. In the QRc-(AGP) model, statistically significant differences were found (F = 5.0548, p <0.05) in AGP’s linear effect between the 0.10 and 0.50 quantiles.
The tests for the equality of the estimated coefficients in the QRc-(CRP, AGP) model indicate that there are significant differences in the quadratic effect of CRP between the 0.10 and 0.25 quantiles (F = 4.1486, p <0.05) and in the effect quadratic of the AGP between quantiles 0.10 and 0.50 (F = 4.5198, p <0.05).
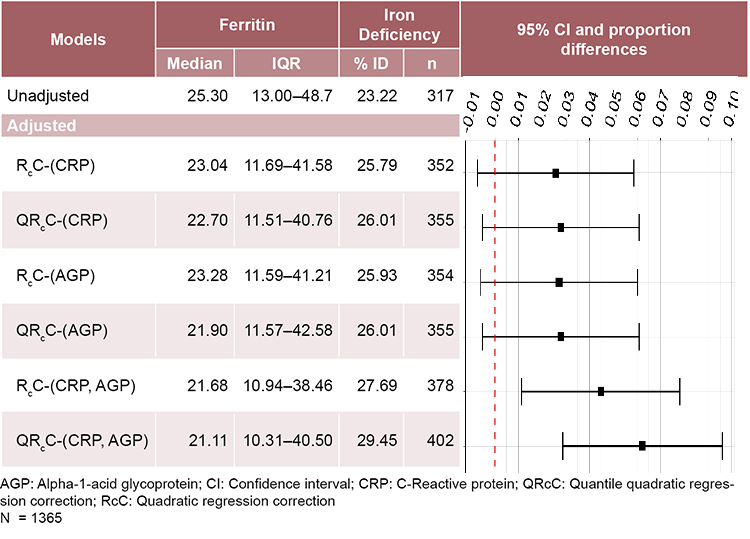
Impact of adjustments on estimated iron deficiency prevalence Table 2 summarizes the median ferritin estimates and adjusted and non adjusted iron deficiency prevalences for the two correction approaches. Adjusting ferritin concentrations using internal reference values for inflammation produced a mean increase in iron deficiency prevalences of 2.6, 2.7 and 4.5 percentage points according to the RcC-(CRP), RcC-(AGP) and RcC-(CRP, AGP) methods. Iron deficiency prevalence calculated using the QRcC-(CRP), QRcC-(AGP), and QRcC-(CRP, AGP) methods led to a mean increase of 2.8, 2.8, and 6.3 percentage points (Table 2).
Table 2: Medians and interquantile ranges (IQR) of unadjusted and inflammation-adjusted ferritin; estimated prevalence of iron deficiency (% ID), unadjusted and adjusted for inflammation. Prevalence differences (proportions and 95% confidence intervals) of ID before and after adjustment by each correction method
The differences in the estimated prevalence of iron deficiency before and after adjustment for RcC-(CRP), QRcC-(CRP), RcC-(AGP) and QRcC-(AGP) do not reach statistical significance, (see graph in Table 2), but they could be important from an epidemiological point of view, since the upper limit of the intervals reaches differences in prevalence >6% with respect to the unadjusted model. However, their confidence intervals overlap, so it cannot be ruled out (with an error probability of less than 5%), that the small prevalence differences obtained from these models are due to chance.
The differences in the prevalence of iron deficiency estimated before and after adjustment by RcC-(CRP, AGP) and QRcC-(CRP, AGP) models are statistically significant (p <0.05). Estimated prevalence is higher when QRcC-(CRP, AGP) is used. In this case, the confidence interval’s upper limit for the differences in prevalence is greater than 9%.
DISCUSSION Coefficients estimated by linear regression for the sample of 1365 children were slightly different than those obtained by Pita,[16] due to the exclusion of the 10 individuals with outliers in AGP and CRP values.
The small values of the R2 and pseudo R2 fit measures[28] and the significant p-values of coefficients in the quadratic regression and quantile quadratic regression models indicate that although the data show high variability, there is a non-linear trend to the response which offers relevant information on the relationship between ferritin and biomarkers for inflammation. Note that the goal of regression correction methods is not to predict ferritin concentrations, but to remove inflammation’s effect on ferritin concentrations. In quantile regression, the best estimate for each individual is the one that minimizes the absolute difference between observed values and estimated values for each of the quantile models.
Quantile regression was able to detect that inflammation may have different effects on different parts of iron status’ conditional distribution. In agreement with other studies,[6,29] we found that high concentrations of CRP and AGP are associated with high ferritin concentrations, but it would be risky to generalize the effect of inflammation on these values. These results suggest that inflammation exerts less influence on ferritin concentrations in children with the highest iron stores.
Reference values for serum ferritin concentrations fall within the range of 15–300 μg/L, and are lower in children.[9] Apparently-healthy children were selected in the current study, so it is expected that in the subpopulation with high ferritin concentrations resulting from high iron stores, physiological homeostasis would be expected to control inflammation’s effect on regulating deviations in iron status indicator ranges, thus maintaining a state of balance in the body.
The use of quadratic regression models to estimate inflammation’s influence on ferritin allows us to recognize that the mean effect of inflammation on ferritin concentrations in this sample is manifested from AGP and CRP values below the limits WHO designates as clinically relevant (CRP ≥5 and AGP >1).[2]
Interest in correcting ferritin focused on the 0.25 quantile, which represents the subpopulation of children with ferritin concentrations close to the cut-off point recommended by WHO to signal iron deficiency (ferritin <12 µg/L). According to the QRcC-(CRP, AGP) method, 80.8% of children with potentially overestimated ferritin values—who, after applying the inflammation correction changed their status from adequate iron stores to iron deficiency—were part of the 0.25 quantile subpopulation.
Inflammation’s effect on the population of children with the highest (0.75 and 0.90 quantiles) and lowest (0.10 quantile) iron stores also provoked an overestimation of ferritin values. However, while an individual correction for inflammation would result in a decrease in estimated ferritin concentration values, these changes would not modify the children’s iron status classification, or, consequently, iron deficiency prevalence.
Using QR as a method of estimating the effects of inflammation on ferritin reduces the bias that undetected ferritin values can introduce. In this investigation, the censored data comprise part of the 10% of observations located below the regression line of the 0.10 quantile, so when substituting the unknown value for the minimum detected value, there is no significant change in estimates of the effects of inflammation biomarkers on ferritin at the distribution’s lower end.
Inflammation’s effects may be more important in some subpopulations than in others, but if the effects estimated in the conditional quantiles are considered equivalent to the effect estimated using only the conditional expectation, the RcC approach may be preferred over the QRcC method, due to its simplicity; especially in population studies. But before making decisions based on these results, the QRc estimate’s confidence intervals should be checked to see whether they include values with important epidemiological implications.
Another aspect to consider is the choice of inflammation cut-off points, because iron deficiency estimates depend not only on figures of iron reserves in the population, but also on the presence of inflammation in the population. To avoid overfitting, corrections of ferritin concentrations are restricted to individuals whose inflammatory biomarkers exceed reference values. The BRINDA group[7] recommends using the upper limit of the first decile of each biomarker as a reference value. Based on this criteria, Pita[16] obtained a CRP reference value of 0.10 mg/L and an AGP reference value of 0.54 g/L.
In the current study, the non-linear trend between inflammation and ferritin concentrations obtained with the quadratic regression models Rc-(CRP) and Rc-(AGP) showed that in a population with low inflammation levels (such as those in the Cuban population),[16] the threshold from which we can assume that inflammation begins to exert influence on ferritin concentrations may be greater than that determined by the upper limit of the first decile (CRP = 0.31 mg/L and AGP = 0.67 g/L).
The QRcC approach reflects the underlying relationship between ferritin and inflammation better than the RC approach, but differences in the estimated effects along the conditional distribution of ferritin with respect to mean effects did not produce important differences in iron deficiency prevalences adjusted by both methods.
Inflammation’s effect on ferritin may be greater in some subpopulations and therefore the adjusted concentrations in these subpopulations will decrease more compared to adjusted concentrations in other subpopulations. However, these differences will only be important to prevalence if they occur in the subpopulation of children whose ferritin values are around the 0.25 quantile, which is the quantile closest to the cut-off point recommended by WHO to define iron deficiency (ferritin <12 µg/L).[2]
In this investigation, the effects of inflammation that were statistically significant at the 0.25 quantile only occurred for CRP’s quadratic effect in the QRc-(CRP) and QRc-(CRP, AGP) models.
Compared with unadjusted prevalence, the RcC and QRcC approaches led to similar iron prevalence estimates when ferritin concentrations were adjusted for CRP or AGP.
The highest estimates were obtained when ferritin concentrations were adjusted for both biomarkers, particularly when the QRcC approach was used. Developing tools to examine correction method validity is both merited and necessary.
One limitation of this study is that the children selected for the study came from a two-stage cluster sample,[16] so the results may not reflect the diversity of the entire Cuban population. Furthermore, its cross-sectional nature precludes analysis of any seasonal influence of inflammation on ferritin concentrations.
CONCLUSIONS The combined use of quadratic regression and quantile regression is a useful analytical resource to explain the peculiarities of how ferritin levels change in the presence of inflammation. Each function’s vertex can be a guide suggesting the threshold from which inflammation begins to influence ferritin concentrations. The quantile regression correction allows estimating higher prevalences of iron deficiency if CRP and AGP values are included at the same time. Correction methods using quadratic regression and quantile quadratic regression models confirm that inflammation can lead to underestimating iron deficiency prevalence in Cuban children aged under five years.
The proposed approach can be used to complement standard correction analysis. Comparisons using different correction methods can reduce discrepancies between statistical estimates, while helping interpret results in both biochemical and epidemiological terms.
ACKNOWLEDGEMENTS We would like to thank the staff at Provincial and Municipal Hygiene, Epidemiology and Microbiology Centers in each province where the work was carried out: Dr Armando Cruz Ramos, Dr Mercedes Elisa Vals, Dr Lídice Bermúdez Herrera, Dr Leandro Cancio Fonseca, Nerys Domínguez López, Dr Karelia Paulí Hechavarría, Damaryz Mendoza Flores, Dr Clarisa Hernández Fernández, Clara de la Rosa Brau, Maile Díaz Espinosa, Dr Olidia Hernández Leyva, Mitzy Ordóñez Casares, Dania Gómez Llopis, Yuneidys Suárez Parra, and Dr Susana Emilia Cardero Pacheco.
We would also like to thank those who participated in the project’s fieldwork: Derbis Campos Hernández, Maytell de la Paz Luna, Elaine Diez López, and the laboratory technicians: Caridad Arocha Oriol, Dania Herrera Javier, as well as the laboratory technicians who processed blood samples in the provinces studied. Yamilia Garriga is also thanked for her support in the laboratory work.
Beard JL, Murray-Kolb LE, Rosales FJ, Solomon NW, Angelilli ML. Interpretation of serum ferritin concentrations as indicators of total-body iron stores in survey populations: the role of biomarkers for the acute phase response. Am J Clin Nutr [Internet]. 2006 Dec [cited 2020 Mar 6];84(6):1498–505. https://doi.org/10.1093/ajcn/84.6.1498
World Health Organization [Internet]. Geneva: World Health Organization; c2022. Publications detail. WHO guideline on use of ferritin concentrations to assess iron status in individuals and populations; 2020 Apr 21 [cited 2021 Jan 2]. 72 p. Available at: https://www.who.int/publications-detail-redirect/9789240000124
Witte DL. Can serum ferritin be effectively interpreted in the presence of the acute-phase response? Clin Chem [Internet]. 1991 Apr 1 [cited 2020 Mar 6];37(4):484–5. https://doi.org/10.1093/clinchem/37.4.484
Raiten DJ, Ashour FAS, Ross AC, Meydani SN, Dawson HD, Stephensen CB, et al. Inflammation and Nutritional Science for Programs/Policies and Interpretation of Research Evidence (INSPIRE). J Nutr [Internet]. 2015 [cited 2020 Mar 6];145(5):1039S–1108S. https://doi.org/10.3945/jn.114.194571
World Health Organization [Internet]. Geneva: World Health Organization; c2022. Serum ferritin concentrations for the assessment of iron status and iron deficiency in populations; 2011 [cited 2014 Jul 5]. Available at: https://www.who.int/vmnis/indicators/serum_ferritin.pdf
Thurnham DI, McCabe LD, Haldar S, Wieringa FT, Northrop-Clewes CA, McCabe GP. Adjusting plasma ferritin concentrations to remove the effects of subclinical inflammation in the assessment of iron deficiency: a meta-analysis. Am J Clin Nutr [Internet]. 2010 Jul 7 [cited 2020 Dec 20];92(3):546–55. https://doi.org/10.3945/ajcn.2010.29284
Namaste SM, Aaron GJ, Varadhan R, Peerson JM, Suchdev PS on behalf of the BRINDAWorking Group. Methodologic approach for the Biomarkers Reflecting Inflammation and Nutritional Determinants of Anemia (BRINDA) project. Am J Clin Nutr [Internet]. 2017 Jun 14 [cited 2020 Dec 18];106(Suppl 1):333S–47S. https://doi.org/10.3945/ajcn.116.142273
Mei Z, Namaste SM, Serdula M, Suchdev PS, Rohner F, Flores-Ayala R, et al. Adjusting total body iron for inflammation: Biomarkers Reflecting Inflammation and Nutritional Determinants of Anemia (BRINDA) project. Am J Clin Nutr [Internet]. 2017 Jul [cited 2020 Dec 18];106(Suppl 1):383S–9S. Epub 2017 Jun 14. https://doi.org/10.3945/ajcn.116.142307 PMID: 28615255; PMCID: PMC5490648.
Suchdev PS, Williams AM, Mei Z, Flores-Ayala R, Pasricha SR, Rogers LM, et al. Assessment of iron status in settings of inflammation: challenges and potential approaches. Am J Clin Nutr [Internet]. 2017 Oct 25 [cited 2020 Dec 18]. https://doi.org/10.3945/ajcn.117.155937
Mwangi MN, Echoka E, Knijff M, Kaduka L, Werema BG, Kinya FM, et al. Iron status of Kenyan pregnant women after adjusting for inflammation using BRINDA regression analysis and other correction methods. Nutrients [Internet]. 2019 Feb 16 [cited 2020 Dec 18];11(2):420. https://doi.org/10.3390/nu11020420
Muriuki JM, Mentzer AJ, Webb EL, Morovat A, Kimita W, Ndungu FM, et al. Estimating the burden of iron deficiency among African children. BMC Med [Internet]. 2020 Feb 27 [cited 2020 Dec 19];18:31. https://doi.org/10.1186/s12916-020-1502-7
Mbunga BK, Mapatano MA, Strand TA, Gjengedal ELF, Akilimali PZ, Engebretsen IMS. Prevalence of anemia, iron-deficiency anemia, and associated factors among children aged 1–5 years in the rural, malaria-endemic setting of Popokabaka, Democratic Republic of Congo: a cross-sectional study. Nutrients [Internet]. 2021 Mar 21 [cited 2021 Jun 3];13(3):1010. https://doi.org/10.3390/nu13031010
Greffeuille V, Fortin S, Gibson R, Rohner F, William A, Young MF, et al. Associations between zinc and hemoglobin concentrations in preschool children and women of reproductive age: an analysis of representative survey data from the Biomarkers Reflecting Inflammation and Nutritional Determinants of Anemia (BRINDA) Project. J Nutr [Internet]. 2021 May [cited 2021 Jun 3 ];151(5):1277–85. https://doi.org/10.1093/jn/nxaa444
Orsango AZ, Habtu W, Lejisa T, Loha E, Lindtjørn B, Engebretsen IMS. Iron deficiency anemia among children aged 2–5 years in southern Ethiopia: a community-based cross-sectional study. Peer J [Internet]. 2021 [cited 2021 Jun 3];9:2021:e11649. https://doi.org/10.7717/peerj.11649
Petry N, Olofin I, Hurrell RF, Boy E, Wirth JP, Moursi M, et al. The proportion of anemia associated with iron deficiency in low, medium, and high human development index countries: a systematic analysis of national surveys. Nutrients [Internet]. 2016 Nov 2 [cited 2021 Jan 2];8:693. https://doi.org/10.3390/nu8110693
Pita-Rodríguez GM, Chávez-Chong C, Lambert-Lamazares B, Montero-Díaz M, Selgas-Lizano R, Basabe-Tuero B, et al. Influence of inflammation in assessing ferritin concentrations in Cuban preschool children. MEDICC Rev [Internet]. 2021 Jul–Oct [cited 2021 Dec 20];23(3):37–45. https://doi.org/10.37757/MR2021.V23.N3.7
Suchdev PS, Namaste SM, Aaron GJ, Raiten DJ, Brown KH, Flores-Ayala R, et al. Overview of the Biomarkers Reflecting Inflammation and Nutritional Determinants of Anemia (BRINDA) Project. Adv Nutr [Internet]. 2016 Mar 15 [cited 2021 May 10];7(2):349–56. https://doi.org/10.3945/an.115.010215
Cichon B, Ritz C, Fabiansen C, Christensen VB, Filteau S, Friis H, et al. Assessment of regression models for adjustment of iron status biomarkers for inflammation in children with moderate acute malnutrition in Burkina Faso. J Nutr [Internet]. 2017 Jan [cited 2020 Mar 6 ];147(1):125–32. https://doi.org/10.3945/jn.116.240028
Namaste SML, Ou J, Williams AM, Young MF, Yu EX, Suchdev PS, et al. Adjusting iron and vitamin A status in settings of inflammation: a sensitivity analysis of the Biomarkers Reflecting Inflammation and Nutritional Determinants of Anemia (BRINDA) approach. Am J Clin Nutr [Internet]. 2020 Aug 4 [cited 2021 Jan 2];112(Suppl 1):458S–67S. https://doi.org/10.1093/ajcn/nqaa141
Weisberg S. Applied Linear Regression 4th ed [Internet]. New Jersey: John Wiley & Sons, Inc; 2014 [cited 2021 Jan 2]. 350 p. Available at: http://z.umn.edu/alr4ed
Huang Q, Zhang H, Chen J, He M. Quantile regression models and their applications: a review. J Biom Biostat [Internet]. 2017 [cited 2020 Dec 10];8:354. https://doi.org/10.4172/21556180.1000354
R Core Team. R: A Language and Environment for Statistical Computing [Internet]. Vienna: R Foundation for Statistical Computing; 2019 [cited 2020 Dec 10]. Available at: https://www.R-project.org/
Bassett G, Koenker R. Tests of linear hypotheses and L1 estimation. Econometrica. 1982 Nov;50(6):1577–84.
Koenker R, Machado JAF. Goodness of fit and related inference processes for quantile regression. J Am Statistical Assoc. 1999;94(448):1296–310. https://doi.org/10.1080/01621459.1999.10473882
Lynch S, Pfeiffer CM, Georgieff MK, Brittenham G, Fairweather-Tait S, Hurrell RF et al. Biomarkers of Nutrition for Development (BOND)—Iron Review. J Nutr [Internet]. 2018 Jun 1 [cited 2020 Dec 10];148(Suppl 1):1001S–67S. https://doi.org/10.1093/jn/nxx036
THE AUTHORS
Minerva Montero-Díaz (Corresponding author: minerva@icimaf.cu), mathematician with a master’s degree in mathematical sciences (statistics) and a doctorate in mathematical sciences. Senior researcher, Mathematics Department. Mathematical Cybernetics and Physics Institute, Havana, Cuba. http://orcid.org/0000-0003-2108-5499
Cristina Chávez-Chong, mathematician with a master’s degree in mathematical sciences. Junior researcher, Mathematics Department, Mathematical Cybernetics and Physics Institute, Havana, Cuba. http://orcid.org/0000-0002-2719-9246
Ernesto Rodríguez-Martínez, mathematician. Mathematics Department, Mathematical Cybernetics and Physics Institute, Havana, Cuba. https://orcid.org/0000-0001-8063-1184
Gisela María Pita-Rodríguez, physician specializing in clinical biochemistry with a master’s degree in environmental health. Associate researcher and associate professor; and head, Nutritional Anemia Laboratory, National Hygiene, Epidemiology and Microbiology Institute (INHEM), Havana, Cuba. http://orcid.org/0000-0002-5590-2461
Brenda Lambert-Lamazares, mathematician with a master’s degree in mathematical sciences. Mathematics Department, Mathematical Cybernetics and Physics Institute, Havana, Cuba. http://orcid.org/0000-0001-9546-5545
Beatriz Basabe-Tuero, biochemist with a master’s degree in public health nutrition and a doctorate in nutrition sciences. Full professor and associate researcher, INHEM, Havana, Cuba. http://orcid.org/0000-0002-9076-579X
No new Early Online articles at this time. The most recent articles are listed in the Current Issue Table of Contents. Early Online articles are added as soon as they are available, so please check back later.