INTRODUCTION On March 11, 2020, WHO declared COVID-19 a pandemic and called on governments to impose drastic measures to fight it. It is vitally important for government health authorities and leaders to have reliable estimates of infected cases and deaths in order to apply the necessary measures with the resources at their disposal.
OBJECTIVE Test the validity of the logistic regression and Gompertz curve to forecast peaks of confirmed cases and deaths in Cuba, as well as total number of cases.
METHODS An inferential, predictive study was conducted using logistic and Gompertz growth curves, adjusted with the least squares method and informatics tools for analysis and prediction of growth in COVID-19 cases and deaths. Italy and Spain—countries that have passed the initial peak of infection rates—were studied, and it was inferred from the results of these countries that their models were applicable to Cuba. This hypothesis was tested by applying goodness-of-fit and significance tests on its parameters.
RESULTS Both models showed good fit, low mean square errors, and all parameters were highly significant.
CONCLUSIONSThe validity of models was confirmed based on logistic regression and the Gompertz curve to forecast the dates of peak infections and deaths, as well as total number of cases in Cuba.
KEYWORDS COVID-19, SARS-CoV-2, logistic models, pandemic, mortality, Cuba
ABSTRACT INTRODUCTION On March 11, 2020, WHO declared COVID-19 a pandemic and called on governments to impose drastic measures to fight it. It is vitally important for government health authorities and leaders to have reliable estimates of infected cases and deaths in order to apply the necessary measures with the resources at their disposal.
OBJECTIVE Test the validity of the logistic regression and Gompertz curve to forecast peaks of confirmed cases and deaths in Cuba, as well as total number of cases.
METHODSAn inferential, predictive study was conducted using logistic and Gompertz growth curves, adjusted with the least squares method and informatics tools for analysis and prediction of growth in COVID-19 cases and deaths. Italy and Spain—countries that have passed the initial peak of infection rates—were studied, and it was inferred from the results of these countries that their models were applicable to Cuba. This hypothesis was tested by applying goodness-of-fit and significance tests on its parameters.
RESULTSBoth models showed good fit, low mean square errors, and all parameters were highly significant.
CONCLUSIONSThe validity of models was confirmed based on logistic regression and the Gompertz curve to forecast the dates of peak infections and deaths, as well as total number of cases in Cuba.
KEYWORDSCOVID-19, SARS-CoV-2, logistic models, pandemic, mortality, Cuba
INTRODUCTION The COVID-19 pandemic and the characteristics of the SARS-Cov-2 viral agent[1] have led many governments to restrict social contact in order to cut the chain of transmission and thus reduce cases and deaths. The measures include some variation of lockdown, which in various countries has proven effective at curbing disease spread, flattening the curve and avoiding health system saturation.[2] Thus, it is vitally important for decision-makers to be able to approximate the maximum number of infections and deaths expected, as well as when caseload peaks will occur.
In Cuba, many measures have been implemented to mitigate COVID-19 spread and to limit the severity of cases and deaths.[3] However, until April 22, 2020, the increase in confirmed case numbers was approximately exponential. Going forward, reliable estimates are needed to inform decision-making in the context of limited resources.
Many such forecasts are made using mathematical modeling. A classic epidemiological model is SIR (Susceptible, Infectious, Recovered), based on ordinary differential equations. This modeling has been used successfully for the COVID-19 pandemic in some regions.[4,5] In Cuba, several authors have also applied it to the COVID-19 pandemic.[6–8]
IMPORTANCE This study confirms the validity of an analytical tool that can be used to forecast the total number of COVID-19 cases and deaths in Cuba at different points in time, allowing health authorities and government to make more informed decisions on use of available resources to stem the pandemic and organize recovery phases.
Other techniques that have been used for modeling COVID-19 are:
Statistical time-series models to predict the number of infections and/or deaths[9]
Data processing to obtain forecasting models using the internet[10]
Models based on artificial intelligence and machine learning[11,12]
These approaches are based on parameters that describe different characteristics of the pandemic. The estimation of these guiding parameters is complex, requiring controlled study of samples or use of approximations. Interpreting the models themselves is also complex.
Among the statistical models are logistic population growth models and the Gompertz growth model.[13] These models have been used in the COVID-19 pandemic and are less complex than those previously mentioned. But they are limited to short-term forecasts since they incorporate few parameters related to changes in epidemic dynamics, such as those that are sensitive to actions of a clinical nature, or to transmission-mitigation measures. To estimate the parameters of these models, the nonlinear least squares method is used. This modeling has been applied worldwide to forecast for incidence and prevalence rates.
Various studies have used logistic models to make predictions regarding COVID-19’s epidemiologic dynamics and the disease’s effects. Batista used the logistic regression model to study the magnitude of the pandemic in China through February 25, 2020;[14] Morais used it in forecasting deaths in China, Iran, Italy, South Korea and Spain;[15] Tátrai and Várallyay applied the model to predict the peaks in various countries affected by COVID-19 and assessed the quality of its fit with data from various regions in China affected by COVID-19.[16] Wu used a logistic model to estimate the peak in confirmed cases for Europe and the United States, and evaluated goodness-of-fit using a sample of 29 provinces in China and 19 countries that had passed the peak.[17] Qaedan used a logarithmic-logistic model to obtain predictions for the state of Utah in the United States and assessed its fit based on adjustments made in South Korea and Italy.[18]
Some studies have implemented the Gompertz model. Mazurek and Nenickova applied it to predict the pandemic’s peaks in the United States.[19] Mazurek took a similar approach to study data for the United Kingdom, the Russian Federation, Turkey and the world as a whole;[20] and Razzak applied the model to predict the course of the pandemic in New Zealand.[21]
Other studies have used both models simultaneously to obtain forecasts for COVID-19. Jia used Gompertz, Bertalanffy, and logistic models to predict COVID-19 case numbers in various regions in China. These authors first studied the models’ goodness-of-fit using data from SARS-CoV-1 confirmed cases in China in 2003.[22] Similarly, based on the goodness-of-fit of the logistic model and the Gompertz model for the data from China and South Korea, Villalobos presented predictions for Costa Rica.[23] Milhinhos and Costa adjusted logarithmic-logistic models and logarithmic-Gaussian models to obtain forecasts for Portugal based on their goodness-of-fit for distribution of COVID-19 data in South Korea.[24]
Dattoli used a three-parameter logistic model and the Gompertz model to make estimates for Italy.[25] Bauckhage used the logistic and Gompertz models to obtain predictions for Germany for mid-April 2020,[26] while Rodrigues-Silva used these models to obtain predictions for the state of Goias in Brazil[27] and Dutra used them to estimate the number of persons affected by COVID-19 for various US states and the whole country.[28] Attanyake fitted logistic, Gompertz and other exponential models to data corresponding to the impact of COVID-19 in Sri Lanka, Italy and Hubei, a province in central China.[29] Ahmadi adjusted the Gompertz, Bertalanffy and cubic polynomial models to forecast pandemic dynamics for April 2020 in Iran.[30]
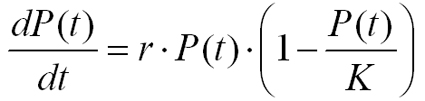
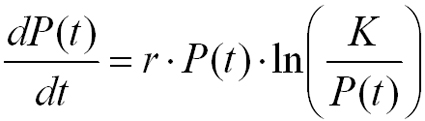
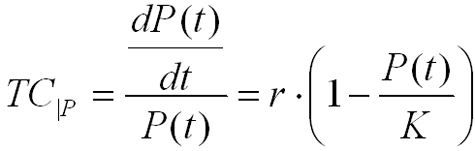
The ordinary differential equations presented in Equation 1 and Equation 2 are known as the logistic differential equation (or Verhulst equation) and Gompertz equation, respectively.[31]
Equation 1: Logistic differential equation
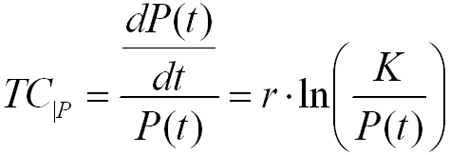
Equation 2: Gompertz differential equation
Both describe the growth of populations where: P(t) represents the number of organisms or the size of a population at a given moment in time, r represents the instantaneous rate of increase and K corresponds to the carrying capacity of the environment or the maximum number of individuals that the population can sustain. K and r are positive real numbers and the function P(t) is positive, monotonically increasing and suitable for representing epidemiological models, as it presents a rapid initial growth that is approximately exponential and as the number of infections increases, the number of non-infected individuals in the population decreases. As a result, the relative growth rate within the population decreases until growth stops when there are no individuals left to infect.
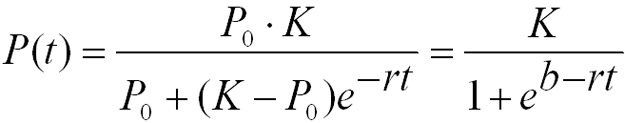
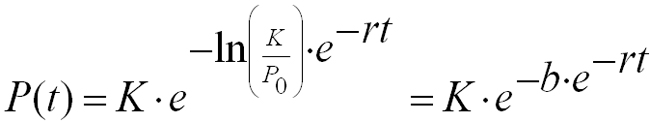
Both models present an explicit solution provided by Equations 3 and 4 for the logistic model and Gompertz models, respectively.
Equation 3: Logistic model (b >0)
Equation 4: Gompertz model (b >0)
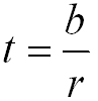
P0 represents the population (P) at the start of the growth process (0 < P0 < K). The b parameter is found to be associated with displacement on the abscissa axis for both sigmoid models. This is obtained through changes in variables (in Equation 3, algebraic transformations were applied before implementing the variable change).
The inflection point for these population growth models is of interest, as it represents the moment at which the rate of growth is highest, which can be interpreted as the peak of the pandemic. The inflection point for the logistic model is presented in Equation 5 while the inflection point for the Gompertz curve is presented in Equation 6. In the logistic model, this point is at 50% of population growth (the logistic function is symmetrical with regard to this point) while this point on the Gompertz model is approximately located between 35% and 40% of population growth.[31]
Equation 5: Inflection point of the logistic model
Equation 6: Inflection point of the Gompertz model
This study aims to fit logistic and Gompertz models to the distribution of COVID-19 in Cuba for confirmed and deceased cases, to demonstrate the fit of these models for these distributions in such a way that they can be generalized as predictive models and to make forecasts for the peak dates of confirmed cases and deaths due to COVID-19 in Cuba.
Equation 7: Relative population growth rate in the logistic model
Equation 8: Relative population growth rate in the Gompertz model
The first aspect studied was the fit of the models used for the distribution of COVID-19 confirmed cases and deaths in Spain and Italy, countries that had passed the peak of the pandemic. The good fit of these models in those countries and their comparative simplicity in relation to other models has piqued interest in applying them to forecasting in Cuba. The adequacy of the models in estimating distribution of confirmed cases and deaths in Cuba was assessed by analyzing the parameters for goodness of fit and testing the models themselves for statistical significance.
METHODS Design and participants This is an inferential and predictive study using the logistic model and the Gompertz growth curve. The curve fitting method was used by applying the least squares technique for non-linear models with respect to their parameters.
This study was conducted from March 16 to April 22, 2020, while Cuba was experiencing the impact of COVID-19, by a group of professors from the Mathematics Department at the Carlos Rafael Rodriguez University of Cienfuegos in collaboration with the Department of Educational Technology at the same institution.
Official data on the number of confirmed cases and deaths from COVID-19 reported by the governments of different countries were studied as summarized by WHO and recorded and published by Johns Hopkins University. These data are updated daily and show cumulative confirmed cases, deaths and recoveries from the disease for different countries and territories. The first record in this database is from January 22, 2020.[32] Data was collected until April 22, 2020.
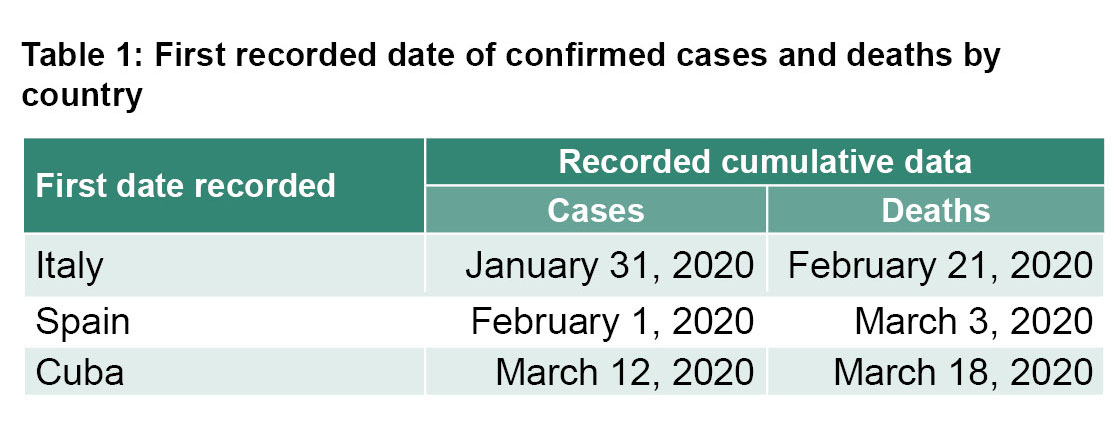
For the countries studied, documentation began with the date of the first recorded confirmed cases or deaths in the territory (Table 1). The daily cumulative cases were recorded in both analyses. In Cuba, the first cases were confirmed on March 11, 2020, but they were recorded in the database the following day.
Study variables The variables analyzed in this investigation are discrete quantitative variables, specifically:
Number of days elapsed since the first positive cases of COVID-19 were confirmed. Each data point for this variable is recorded on a daily basis: for example, in the case of Cuba, the first day corresponds to March 12, 2020 and the second corresponds to March 13.
Number of days elapsed since the first confirmed deaths of patients diagnosed with COVID-19. These values are recorded in a similar way to the previous variable, but using the database corresponding to deaths.
Number of confirmed daily cumulative cases for COVID-19.
Number of daily cumulative deaths for patients diagnosed with COVID-19.
Data Management and Processing Downloaded daily as .csv files, data were decoded using programmed scripts for that purpose.
The Maxima 5.41.0[33] symbolic software programs and R 3.6.1[34] programming language for number processing were used to process the data.
To use the least squares method, the lsquare.mac (version 5.41.0) package was used in the Maxima program and for the commands for R; nls, SSlogis and SSgompertz from the stat package (version 3.6.1) and drm from the drc package (version 3.0-1) were used. To study the Root Mean Square Error (RMSE) and the significance of the parameters of the model, the summary command from the stat package (version 3.6.1) was used and the adjusted R2 was calculated using rSquared from the miscTools package (version 0.6-22). To determine the goodness-of-fit for the model, the command neill.test from the drc package (version 3.0-1) was used.
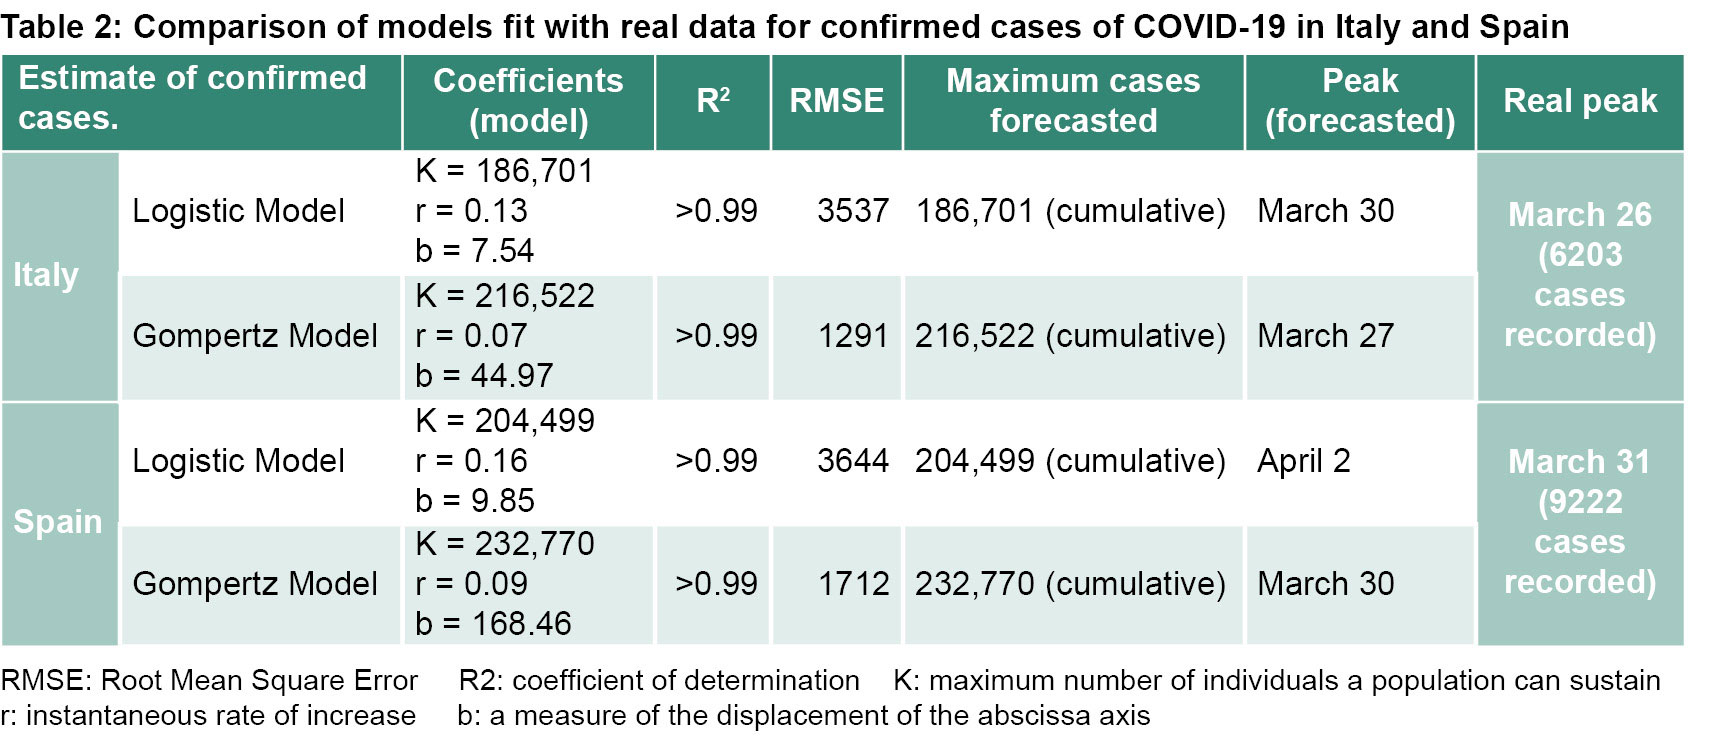
Analysis The logistic and Gompertz models were fitted to the data published for COVID-19 for confirmed cases and deaths in Spain and Italy. Italy had its peak of confirmed cases on March 26, 2020 and its peak deaths on March 27, 2020.[35] Spain had its peaks of confirmed cases and deaths on March 31, 2020 and April 2, 2020, respectively.[36] As of April 22, 2020, according to the Johns Hopkins database, Italy had reported a total of 187,327 confirmed cases due to COVID-19 with 25,085 deaths, while Spain had recorded 208,389 confirmed cases and 21,717 deaths. As these countries had passed the peak of the pandemic, the official published data on the peaks was compared to the forecasts obtained using the models.
The RMSE and the R2 adjusted coefficient of determination were calculated to study the goodness-of-fit of the models, while keeping in mind that, for both models, values close to 1 for R2 and lower values for RMSE indicate a better fit.
The models were adjusted to the data published for COVID-19 for confirmed cases and deaths in Cuba. Goodness-of-fit was determined using the analyses of R2 and RMSE. Significance of the models’ adjusted coefficients was determined using the t test. Goodness-of-fit was verified using the Neill test, which is suitable for non-linear models with respect to the established parameters, and which utilizes grouping techniques in the event that there are no replicates.[37] The significance threshold selected a priori was alpha = 0.05.
Once the models’ statistical significance had been demonstrated for distributions of confirmed COVID-19 cases and deaths in Cuba, these models were used to forecast the same.
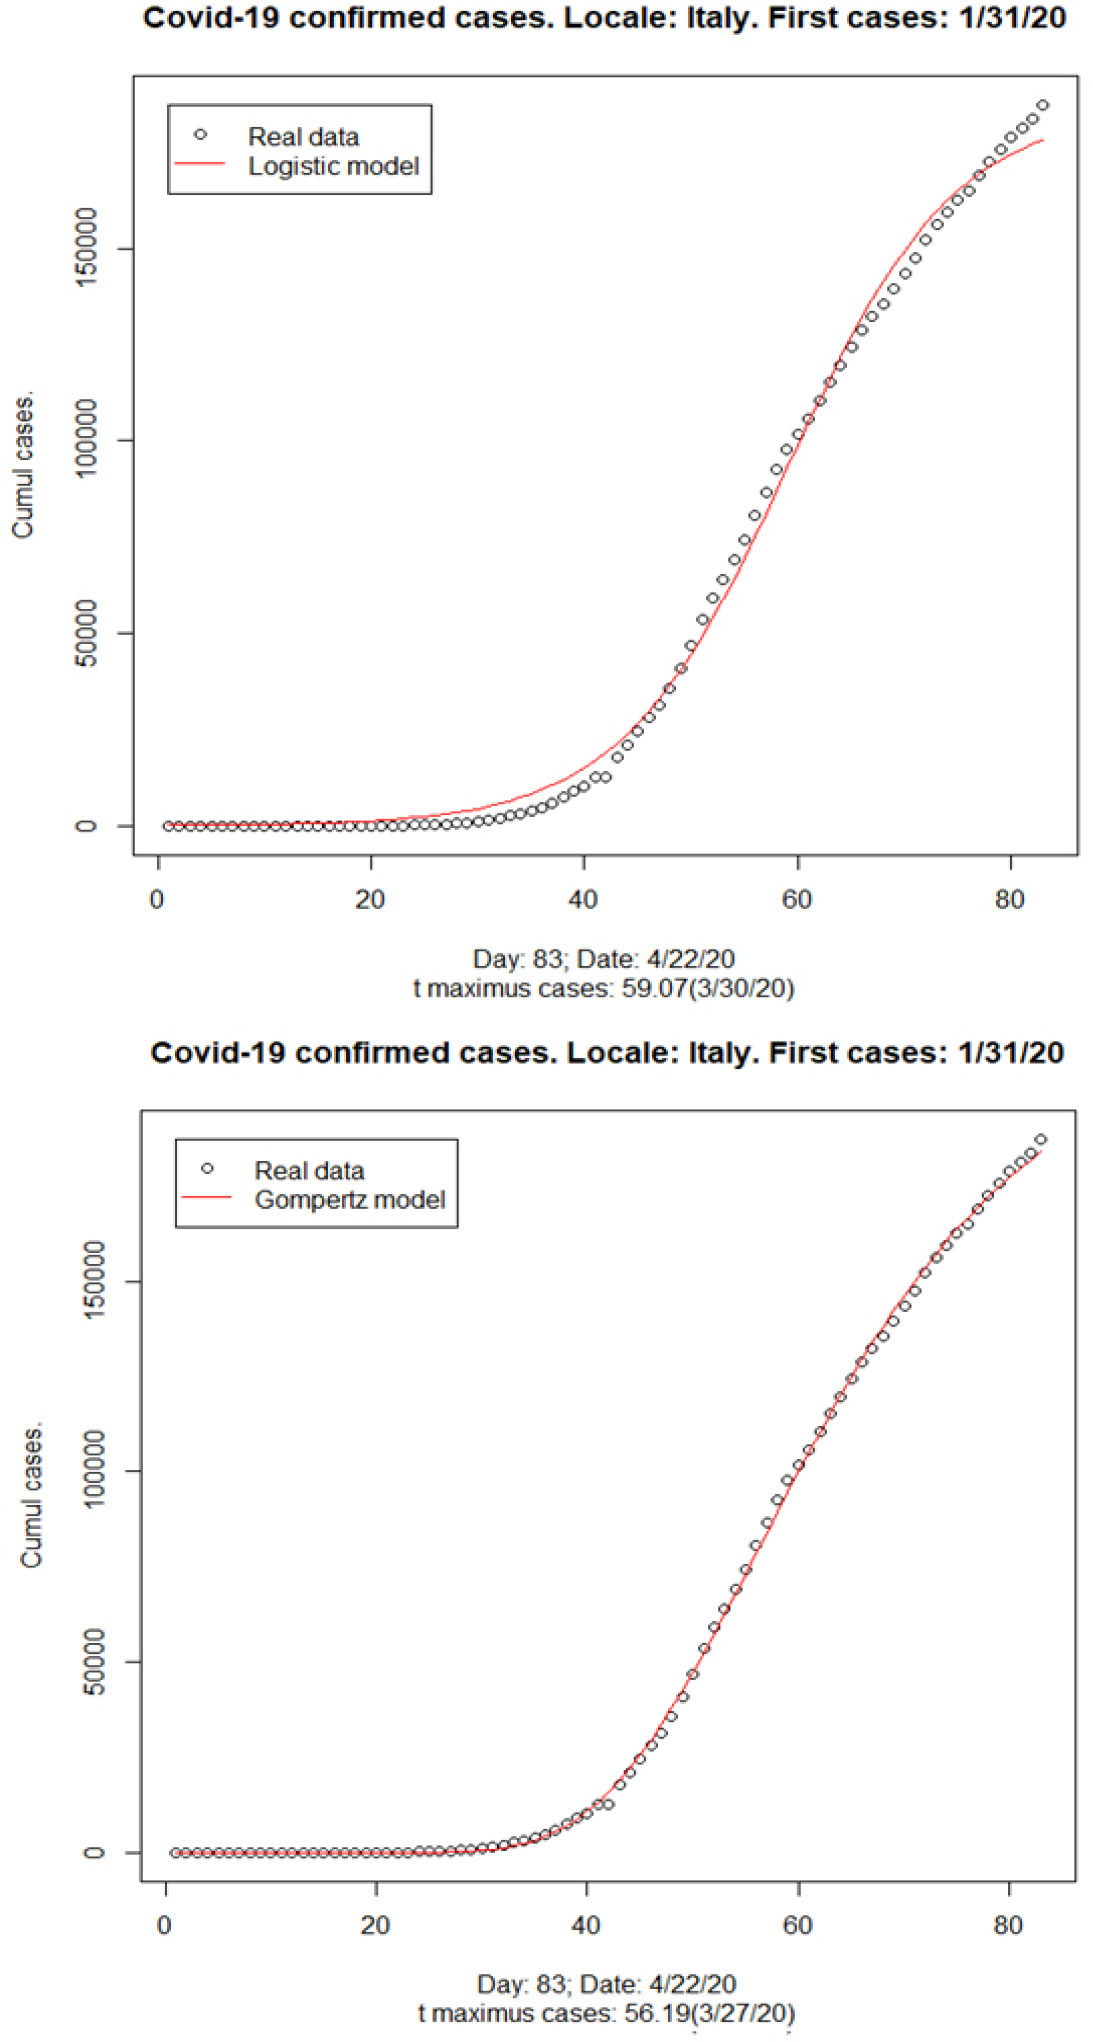
RESULTS Confirmed cases of COVID-19 Case Study, Italy The first case was recorded on January 31, 2020. However, it was not until February 21 that exponential growth of the pandemic was officially reported. Figure 1 presents the geometric representation of cumulative confirmed cases and the logistic model (Equation 3) and Gompertz curve (Equation 4). Table 2 presents the adjusted coefficients for each model, R2, the RMSE values obtained for each, and the forecasted peaks. Both models show an R2 greater than 0.99 with a notably lower RMSE in the Gompertz model. Using the logistic model, the peak was forecast at 60 days (March 30) after first case, while the Gompertz model forecasts it at 57 days (March 27).
Figure 1: Logistic model and Gompertz curve: confirmed COVID-19 cases in Italy
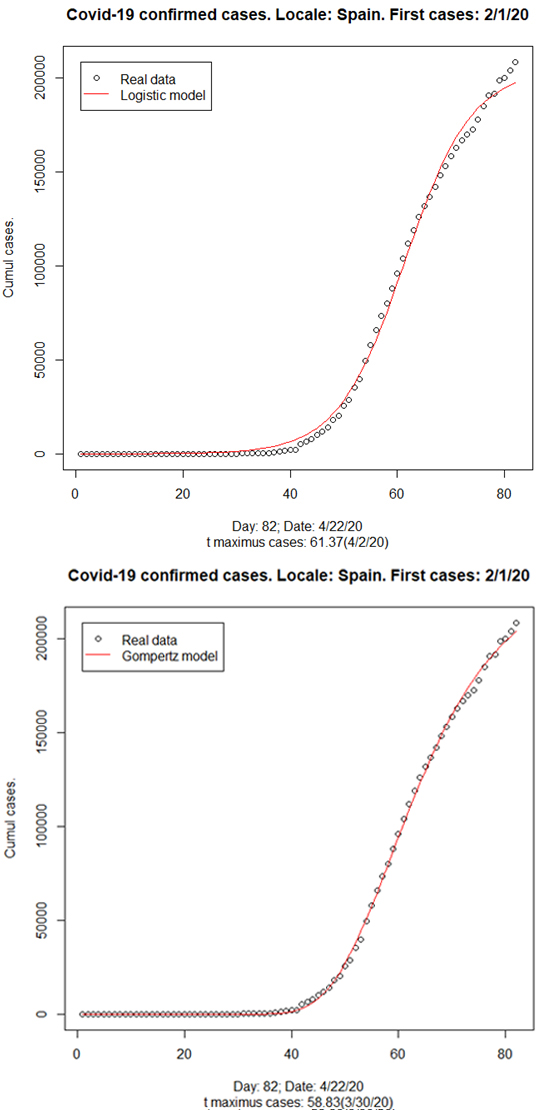
Case Study, Spain The first case was recorded on February 1, 2020. However, it was not until February 25 that the pandemic’s exponential growth was officially reported. Figure 2 shows the geometric representation of cumulative confirmed cases, according to the logistic model (Equation 3) and Gompertz model (Equation 4).
Table 2 shows R2 greater than 0.99 for both models. The Gompertz model shows a lower RMSE than the logistic model, which suggests a better fit. The estimated peak, according to the logistic model, is calculated at 62 days (April 2); while the estimated peak for the Gompertz model is estimated at 59 days (March 30).
Figure 2: Logistic model and Gompertz curve: confirmed COVID-19 cases in Spain
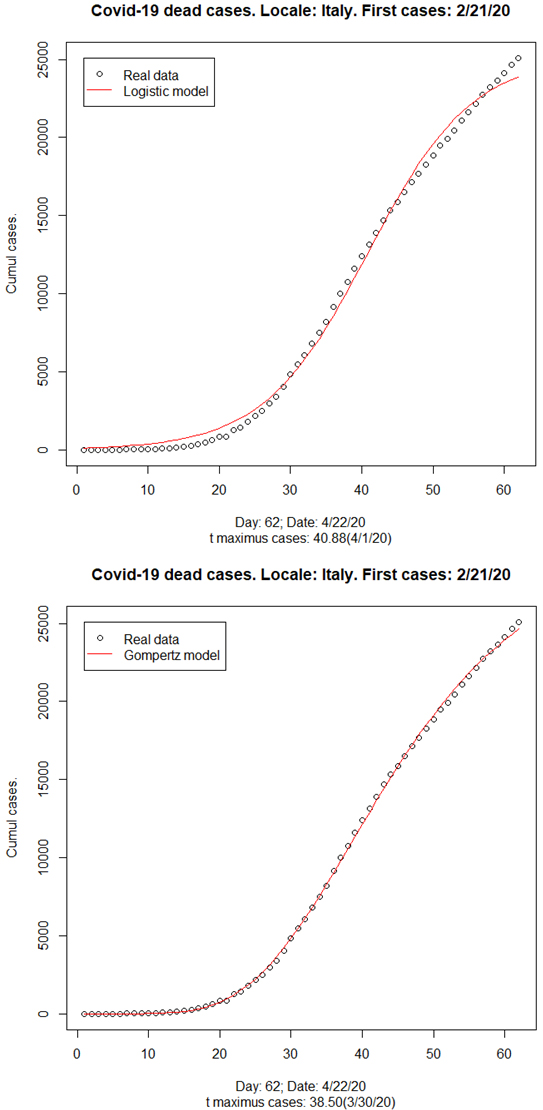
Figure 3: Logistic model and Gompertz curve: COVID-19 deaths in Italy
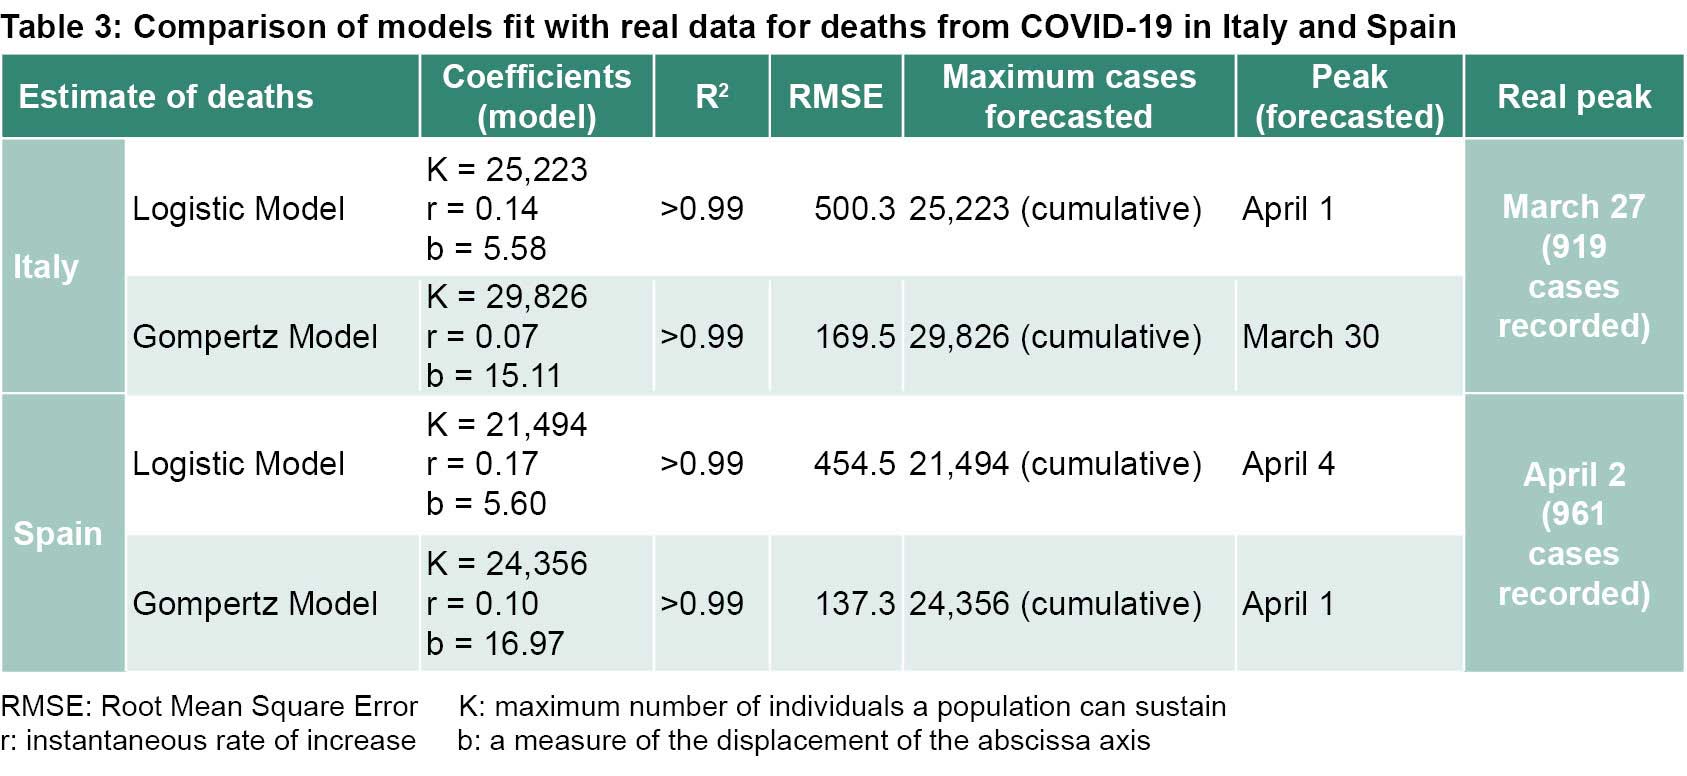
COVID-19 deaths Case Study, Italy The first death was reported on February 21. The graph in Figure 3 shows the geometric representation of observed cumulative deaths and the estimations by the logistic model (Equation 3) and Gompertz curve (Equation 4). Both models have an R2 greater than 0.99, however, the Gompertz model has a lower RMSE than the logistic model (Table 3). The logistic model has a forecasted peak at 41 days (April 1), while the forecasted peak for the Gompertz model is 39 days (March 30) after the appearance of the first case in the country (February 1).
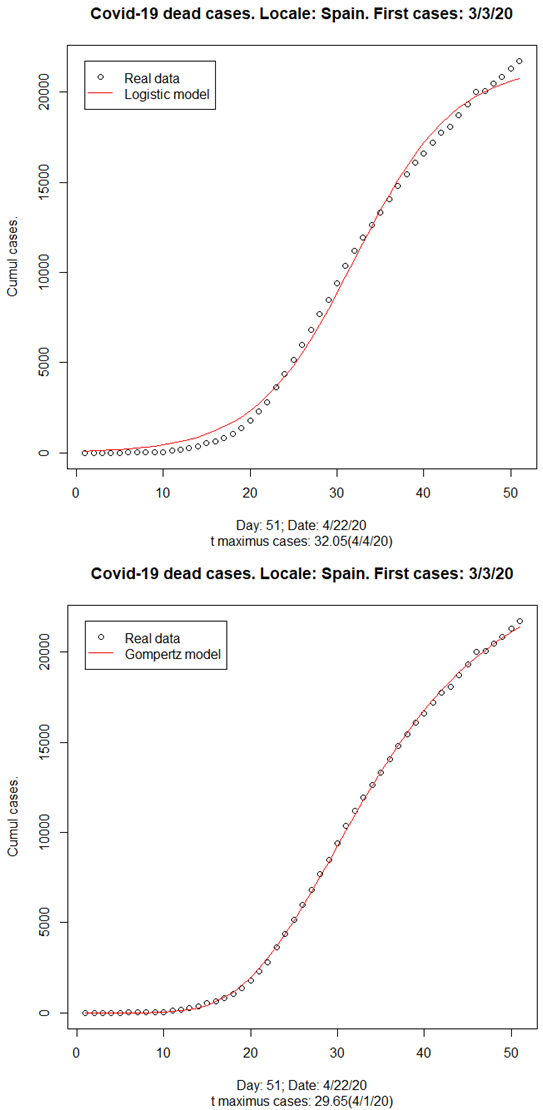
Case Study, Spain The first death was reported on March 3. Figure 4 shows the geometric representation of observed and predicted cases and deaths by the logistic model (Equation 3) and Gompertz model (Equation 4). Both models had an R2 higher than 0.99, however the Gompertz model had a smaller RMSE (Table 3). The logistic model had a projected peak at 33 days (April 4) while the projected peak for the Gompertz model is estimated at 30 days (April 1) after the reporting of the first death in the country.
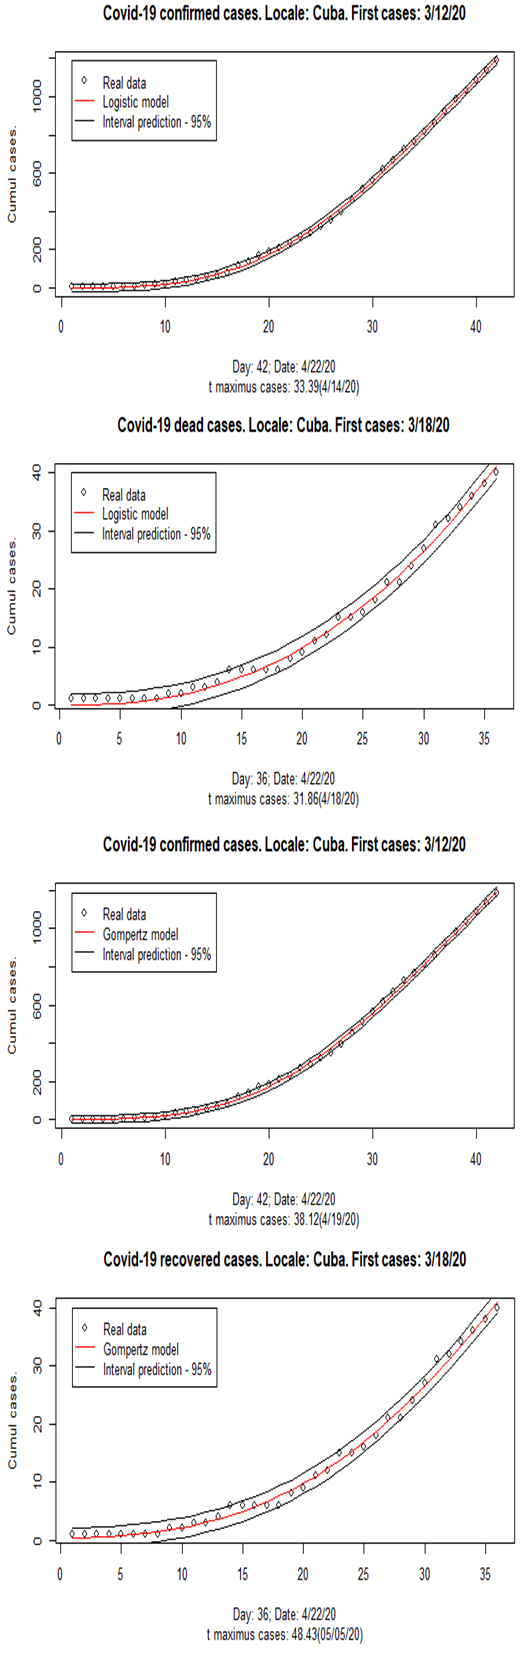
Estimation for Cuba The first cases were diagnosed on March 11, recorded on March 12, and the first death was on March 18. As of April 22, it had been 42 days since the first report of infection and 36 days since the first death. Figure 5 presents the geometric representation of observed cumulative confirmed cases and deaths using the logistic model (Equation 3) and Gompertz curve model (Equation 4). On the graph, it can be observed that the models were correctly fitted to the data and the increase in the data is within the prediction interval of 95%.
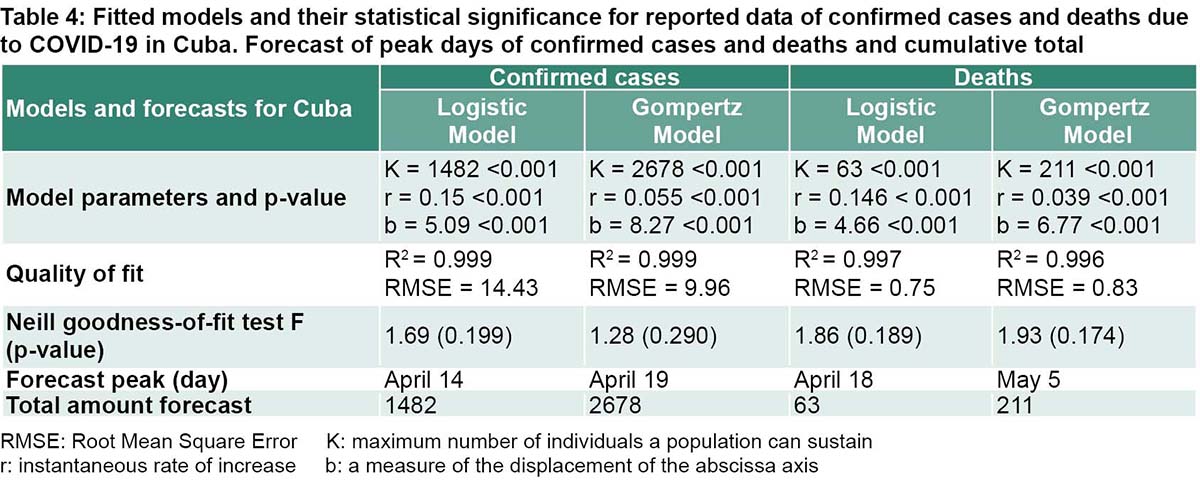
The model-generated forecasts for Cuba provide a projected peak of infection between 34 and 39 days after first report of COVID-19 cases (March 12) and put the peak of deaths between 32 and 49 days after confirmation of the first death in the country (March 18). As with Spain and Italy, the Gompertz model forecasts a greater total number of confirmed cases and deaths than the logistic model. Table 4 shows the coefficients corresponding to the logistic models and Gompertz models fitted to the reported Cuban data for confirmed COVID-19 cases and deaths. The criteria for the goodness-of-fit were similar for both models; they are slightly better in the Gompertz model for the distribution of confirmed cases and in the logistic model for the distribution of deaths.
Associated p values for the significance tests for the coefficients were all less than 0.05, indicating that the models were acceptable. Goodness-of-fit was demonstrated using the Neill test, which presents levels of significance higher than 0.05 for each model in each of the applied distributions (confirmed cases and deaths). This also demonstrates an acceptable fit for the models and thus their suitability for prognostic purposes.
Forecasts for the days with the highest numbers of infection and deaths were obtained using the calculation of the inflection point in each adjusted model and the cumulative totals corresponding to the K parameter (Table 4).
Figure 4: Logistic model and Gompertz curve: COVID-19 deaths in Spain
DISCUSSION The logistic growth and Gompertz models provided good forecasts for Italy and Spain. For both countries, the Gompertz model had better estimates for the peak in confirmed cases and deaths. In the case of Italy, this model provided forecasts with an error of one day later and three days later for the peaks of infection and deaths respectively in comparison to the real peaks presented for that country. For Spain, the Gompertz model presented the forecasts for the peaks in infection and death with one day of error earlier than the real dates on which these peaks occurred. The Gompertz model forecasts a higher total number of cases and deaths than the logistic model in both countries.
Figure 5: Logistic model and Gompertz curve: confirmed COVID-19 cases and deaths in Cuba
The authors hypothesized that if the models provided good forecasts for Spain and Italy, they would also do so for Cuba. Various authors[16–18,22–24] have used this subjective principle of plausibility and have anticipated goodness-of-fit in territories that had not yet passed the peak of the pandemic, based on adequate fit in other territories that had passed their peaks.
To test this hypothesis, the models were fitted to the distribution of confirmed cases and deaths recorded in Cuba and goodness-of-fit was assessed. Significance testing for the models’ coefficients demonstrated their validity. Each of the models passed the Neill goodness-of-fit test, which makes it possible to generalize these models to mathematically describe the dynamics of the pandemic.
CONCLUSIONS The logistic and Gompertz population growth models used to predict peaks and total numbers of infected cases and deaths due to COVID-19 have been statistically validated with the usual analytical resources, which confirmed the initial hypothesis that these models could be extrapolated and applied in Cuba. This provides two additional options that are methodologically viable to model epidemiological processes over time, especially for short-term forecasting and when the aim is not to include the influence of a large number of external factors.
Abreu Pérez MR, Gomez Tejeda JJ, Diéguez Guach RA. Características clínico-epidemiológicas de la COVID-19. Rev Habanera Cienc Médicas. 2020;19(2):3254. Spanish.
Saez M, Tobias A, Varga D, Barceló MA. Effectiveness of the measures to flatten the epidemic curve of COVID-19. The case of Spain. Sci Total Environ. 2020;727:138761. doi:10.1016/j.scitotenv.2020.138761.
Li C, Chen LJ, Chen X, Zhang M, Pang CP, Chen H. Retrospective analysis of the possibility of predicting the COVID-19 outbreak from Internet searches and social media data, China, 2020. Eurosurveillance. 2020 Mar 12;25(10):1–5.
Yang Z, Zeng Z, Wang K, Wong S-S, Liang W, Zanin M, et al. Modifi ed SEIR and AI prediction of the epidemics trend of COVID-19 in China under public health interventions. J Thorac Dis. 2020;12(3):165–74.
Bizet NC, de Oca ACM. Modelos SIR modificados para la evolución del COVID19. ArXivPrepr ArXiv200411352 [Internet]. 2020 Apr 23 [cited 2020 Jun 13]. Available at: https://arxiv.org/pdf/2004.11352
Pérez Rodríguez R, Curra Sosa DA, Almaguer Mederos LE. Análisis preliminar de modelos SIRD para la predicción de la COVID-19: caso de la provincia de Holguín. An Acad Cienc Cuba. 2020;10(2). Spanish.
Vidal Ledo MJ, Guinovart Díaz R, Baldoquín Rodríguez W, Valdivia Onega NC, Morales Lezca W. Modelos matemáticos para el control epidemiológico. Educ Médica Super. 2020 May 30;34(2). Spanish.
Deb S, Majumdar M. A time series method to analyze incidence pattern and estimate reproduction number of COVID-19. ArXiv.org [Internet]. 2020 Mar 24 [cited 2020 Jun 13]. Available at: https://arxiv.org/pdf/2003.10655
Wang CJ, Ng CY, Brook RH. Response to COVID-19 in Taiwan: big data analytics, new technology, and proactive testing. JAMA. 2020 Mar 3;323(14):1341–2.
Hu Z, Ge Q, Jin L, Xiong M. Artifi cial intelligence forecasting of COVID-19 in China. ArXiv.org [Internet]. 2020 Mar 1 [cited 2020 Apr 22]. Available at: https://arxiv.org/pdf/2002.07112
Zhou C, Su F, Pei T, Zhang A, Du Y, Luo B, et al. COVID-19: Challenges to GIS with Big Data. Geogr Sustain. 2020 Mar 1;1(1):77–87.
Simón Mínguez F. Procesos de difusión Logístico y Gompertz. Métodos numéricos clásicos en la estimación paramétrica [thesis]. [Granada]: Granada University (ES); 2016. Spanish.
Morais AF. Logistic approximations used to describe new outbreaks in the 2020 COVID-19 pandemic. ArXiv:200311149 [Internet]. 2020 Mar 24 [cited 2020 Jun 13]; [9 p.]. Available at: https://arxiv.org/pdf/2003.11149
Tátrai D, Várallyay Z. COVID-19 epidemic outcome predictions based on logistic fitting and estimation of its reliability. ArXiv:2003.14160[qbio.PE] [Internet]. 2020 Mar 31 [cited 2020 Jun 13]; [15 p.]. Available at: http://arxiv.org/abs/2003.14160
Wu K, Darcet D, Wang Q, Sornette D. Generalized logistic growth modeling of the COVID-19 outbreak in 29 provinces in China and in the rest of the world. ArXiv200305681 Phys Q-Bio Stat [Internet]. 2020 May 9 [cited 2020 Jun 13]; [34p.]. Available at: http://arxiv.org/abs/2003.05681
Qeadan F, Honda T, Gren LH, Dailey-Provost J, Benson LS, VanDerslice JA, et al. Naive forecast for COVID-19 in Utah based on the South Korea and Italy models-the fluctuation between two extremes. Int J Environ Res Public Health. 2020 Apr 16;17(8):2750.
Mazurek J, Neničková Z. Predicting the number of total COVID-19 cases in the USA by a Gompertz curve [Internet]. 2020 Apr 18 [cited 2020 Jun 13]. Available at: http://rgdoi.net/10.13140/RG.2.2.19841.81761
Mazurek J, Perez Rico C, Fernandez Garcia C. Forecasting the number of COVID-19 cases and deaths in the World, UK, Russia and Turkey by the Gompertz curve [Internet]. 2020 May 4 [cited 2020 Jun 13]. Available at: https://doi.org/10.13140/RG.2.2.32701.61925
Razzak WA. Modelling New Zealand COVID-19 infection rate, and the efficacy of social distancing policy. Discussion paper 20.04 [Internet]. Wellington (NZ): Massey University Business School; 2020 Mar [cited 2020 Jun 13]. 8 p. Available at: http://econfin.massey.ac.nz/school/publications/discuss/2020/DP2004.pdf
Jia L, Li K, Jiang Y, Guo X. Prediction and analysis of Coronavirus Disease 2019. ArXiv200305447 Q-BioPE [Internet]. 2020 Mar 16 [cited 2020 Apr 22]; [19 p.]. Available at: https://arxiv.org/abs/2003.05447
Villalobos-Arias M. Estimation of population infected by COVID-19 using regression Generalized logistics and optimization heuristics. ArXiv200401207 Q-Bio [Internet]. 2020 Apr 2 [cited 2020 Apr 22]; [16 p.]. Available at: http://arxiv.org/abs/2004.01207
Milhinhos A, Costa PM. On the progression of COVID19 in Portugal: a comparative analysis of active cases using non-linear regression. medRxiv [Internet]. 2020 May 6 [cited 2020 Jun 13]. 8 p. Available at: http://medrxiv.org/lookup/doi/10.1101/2020.05.02.20088856
Dattoli G, Di Palma E, Licciardi S, Sabia E. A note on the evolution of COVID-19 in Italy. ArXiv200308684 Q-Bio [Internet]. 2020 Mar 19 [cited 2020 Jun 13]. Available at: http://arxiv.org/abs/2003.08684
Rodrigues Silva R, Velasco WD, Marques W da S, Tibirica CAG. A Bayesian analysis of the total number of cases of the COVID 19 when only a few data is available. A case study in the state of Goias, Brazil. medRxiv [Internet]. 2020 Apr 22 [cited 2020 Jun 13]; [14 p.]. Available at: http://medrxiv.org/lookup/doi/10.1101/2020.04.19.20071852
Dutra CM. Non-Linear fi tting of Sigmoidal Growth Curves to predict a maximum limit to the total number of COVID-19 cases in the United States. medRxiv [Internet]. 2020 Apr [cited 2020 Jun 13]; [7 p.]. Available at: http://medrxiv.org/lookup/doi/10.1101/2020.04.22.20074898
Attanayake AMCH, Perera S, Jayasinghe S. Phenomenological modelling of COVID-19 epidemics in Sri Lanka, Italy and Hebei Province of China. Infectious Diseases (except HIV/AIDS) [Internet]. 2020 May 8 [cited 2020 Jun 13]; [12 p.]. Available at: http://medrxiv.org/lookup/doi/10.1101/2020.05.04.20091132
Ahmadi A, Fadaei Y, Shirani M, Rahmani F. Modeling and Forecasting Trend of COVID-19 Epidemic in Iran until May 13, 2020. medRxiv [Internet]. 2020 Mar [cited 2020 Jun 13]. Available at: http://medrxiv.org/lookup/doi/10.1101/2020.03.17.20037671
Winsor CP. The Gompertz curve as a growth curve. Proc Natl Acad Sci U S A. 1932 Jan;18(1):1–8.
Humanitarian Data Exchange [Internet]. Novel Coronavirus (COVID-19) Cases Data [Internet]. New York: United Nations Offi ce for the Coordination of Humanitarian Affairs (OCHA); c2020 [cited 2020 Apr 22]. Available at: https://data.humdata.org/dataset/novel-coronavirus-2019-ncov-cases
Maxima, a Computer Algebra System [Internet]. Massachusetts: Massachusetts Institute of Technology (MIT);c2020 [cited 2020 Apr 22]. Available at: http://maxima.sourceforge.net/
R: The R Project for Statistical Computing [Internet]. [place unspecifi ed]: R: The R Project for Statistical Computing; 2020 [cited 2020 Apr 22]. Available at: https://www.r-project.org/
Neill JW. Testing for lack of fit in nonlinear regression. Ann Stat. 1988 Jun;16(2):733–40.
THE AUTHORS Juan Felipe Medina-Mendieta (Corresponding author: jfelipemm@ucf.edu.cu), computer sciences engineer with a master’s degree in new technologies. Assistant professor of mathematics, Carlos Rafael Rodríguez University of Cienfuegos, Cuba. https://orcid.org/0000-0002-0508-9783 Manuel Cortés-Cortés, mathematician with a doctorate in economics. Full professor of mathematics, Carlos Rafael Rodríguez University of Cienfuegos, Cuba. https://orcid.org/0000-0002-9903-3907 Manuel Cortés-Iglesias, computer sciences engineer with a master’s degree in applied mathematics. Assistant professor specializing in educational technology, Carlos Rafael Rodríguez University of Cienfuegos, Cuba. https://orcid.org/0000-0002-4517-9820
Submitted: April 29, 2020 Approved: July 17, 2020 Disclosures: None
Medina-Mendieta JF, Cortés Cortés M, Cortés Iglesias M. COVID-19 forecasts for Cuba using logistic regression and Gompertz curves. MEDICC Rev. 2020 Jul;22(3):p33–p39. https://doi.org/10.37757/MR2020.V22.N3.8
No new Early Online articles at this time. The most recent articles are listed in the Current Issue Table of Contents. Early Online articles are added as soon as they are available, so please check back later.