INTRODUCTION
There is general consensus that anthropometric measures (mainly birth weight, crown-rump length and head circumference) are useful parameters for monitoring fetal growth and a neonate’s nutritional status.[1–4] Intrauterine growth parameters are important when establishing short- and medium-term postnatal prognosis.
Population studies as well as studies of selected neonatal groups are needed to assess whether an infant has attained satisfactory growth and nutritional status and to identify at-risk groups. This necessity is corroborated by multiple investigations (including those by Lausman in Canada,[5] Polloto[6] and Lagos[7]) that examine potential neonatal complications from intrauterine growth restriction, such as respiratory distress, hypothermia, hypoglycemia and necrotizing enteritis. Other disorders can also occur in early childhood (cardiovascular diseases, arterial hypertension, diabetes mellitus and kidney problems, etc.). Studies by Mañalich,[8] Susuki,[9] Fattal[10] and Pérez[11] elucidate some of the evidence related to these.
Assessment of birth weight alone, however, started to lose ground after studies by Lubchenco[12] and Battaglia and Lubchenco[13] began to examine weight in relation to gestational age (in weeks) and growth percentile curves, making it possible to identify the following categories: small for gestational age (SGA) if the infant’s birth weight is below the 10th percentile (P10); appropriate for gestational age (AGA) if the infant’s weight is in the 10th–90th percentile range; and large for gestational age (LGA) for infants whose birth weight exceeds the 90th percentile. In light of the lack of any previously established standards, these new standards were rapidly accepted and applied, especially here in the Americas.
As time passed, however, new weight standards related to gestational age (in weeks) were proposed by Latin American authors such as Alarcón,[14] González,[15] Pazcusso,[16] Parra,[17] and Urquía,[18] who presented evidence that P10 figures were higher than those found by Battaglia and Lubchenco.[13] After 1995, when WHO established criteria to set these standards,[1] numerous studies were conducted in Latin America with country-specific populations; Parra,[17] Ticona,[19,20] and more recently, Villamonte[21] in Peru; Montoya in Colombia;[22]; San Pedro in Argentina;[23] and Lagos and Juez in Chile.[24–26]
Intercountry differences observed in their results may be due, among other factors, to variations in features of the population studied, varying demographic and environmental factors, sample size and varying inclusion/exclusion criteria applied by the researchers.[27–30]
In Cuba, the situation of standards relating weight and gestational age has not progressively developed since the curves proposed by Dueñas in 1990.[31] Dueñas is important historically and scientifically, not only because he was the first Cuban to design weight percentile curves by week of gestational age, but also because he realized the importance of these curves for identifying newborn infants whose weight for gestational age was less than P10, given this group’s greater risk of morbidity and mortality.[32–35] No other weight-for-gestational-age curves have been designed in Cuba since.
We consider Dueñas’ curves[31] no longer unsuitable for several reasons. First, they were designed more than two decades ago; second, Dueñas’ small study sample was not representative of the universe at that time (as he acknowledges); and third, more recent criteria for constructing such curves have been established. Esquivel, in a comprehensive review of all growth monitoring studies in the country from the 1970s on, concluded that Cuban newborns have been getting bigger.[36]
No national or regional studies have been conducted in our country that would allow comparison with the reference values determined in our work. Cuba’s 2010 Consensus on Diagnostic and Therapeutic Procedures in Gynecology and Obstetrics[37] contains no mention of reference weights by gestational age for Cuban infants, but refers only to reports by foreign authors, such as Hadlock[2,3] and Usher,[4] among others. Cuba’s 2010 Pediatric Consensus refers only to Dueñas’ curves.[38]
For all these reasons and in light of WHO’s recommendation that each perinatology service or area construct its own references,[1] we decided to formulate weight-for-gestational-age tables and curves for our hospital’s area of service.
METHODS
A retrospective longitudinal study was designed whose universe consisted of the 16,018 infants born alive in the maternity unit of the V.I. Lenin University General Hospital in Holguín Municipality, January 2008–December 2012. In 2012, only infants born at 36 weeks or less were included, due to the need to increase the number of cases in this age group.
Included were neonates born in the study hospital living in Holguín Municipality. Neonates from multiple births were excluded. Also excluded were any cases with omissions or errors in gestational age or weight in the infant’s records. Infants with histories of conditions that could affect intrauterine growth were not excluded.
The study database was set up with information from the Municipal Statistics Department’s registry of live births. Study variables included gestational age, birth weight and sex. Gestational age was determined from date of last menstrual period and corrected, if necessary, by early sonogram (between 13–16 and 20–22 weeks of pregnancy), in accordance with nationally established criteria for antenatal control and followup of all pregnant women.[37]
Weight was determined in grams. Neonates in the study hospital are weighed immediately after birth in the delivery room by experienced nurses, under direct supervision by obstetricians. The dial scales used are routinely calibrated by the Provincial Metrology Department.
To determine weight curves for gestational age and sex, values were determined for the 3rd, 5th, 10th, 25th, 50th, 75th and 90th percentiles. To smooth the curves, a third-degree polynomial was obtained via weighted least squares regression. Mean weights, standard deviations and weight distribution by gestational age and sex were determined for each of these percentiles.
For data validation, analysis of variance was conducted to compare the years 2008, 2009, 2010 and 2011; no unexpected effects were found to influence results, and the coefficient of variation (CV) for each table was calculated, which was considered to be stable when there was no more than 10% variation in each week of gestation. The normality test was also conducted to determine if weight was normally distributed. Calculations were performed with SYSLAT MY-STAT v.12 (2009) and Excel (Microsoft Office).
Ethics The study was approved by the scientific council and medical ethics committee of the Holguín Municipal Health Department
RESULTS
Weight distribution curves by gestational age and sex for the 3th, 5th, 10th, 25th, 50th, 75th and 90th percentiles are displayed in Figures 1 and 2. Mean birth weight for both sexes increased from week 30 to week 42. Table 1 shows a predominance of births in weeks 39 and 40 for newborn girls (29.4% and 27% respectively). Mean weights were 3222 g (SD 381) in week 39 and 3331 g (SD 398) in week 40.
Figure 1: Weight distribution in newborn girls by gestational age (n = 8025)
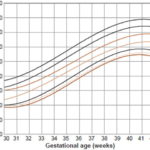
Figure 2: Weight distribution in newborn boys by gestational age(n = 7993)
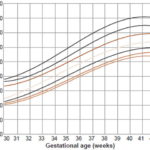
Table 1: Weight distribution in newborn girls by gestational age (n = 8025)
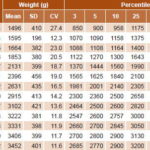
Figure 1 shows weight distribution for newborn girls by gestational age (in weeks). At 36 weeks, P10 for this group was 2140 g, and showed a steady rise until week 42. Applying those values, 9.4% of newborn girls fall under P10 and 9.8% above the 90th percentile. Weight distribution for newborn boys by gestational age (Figure 2) shows that P10 was 2200 g at 36 weeks, with increasing values up to week 42. Based on these values, 9.8% of infant boys are below P10 and 8.3% are above the 90th percentile. Applying our cutoffs to the universe of newborns, 47.3% more low birth weight infants were identified than would have been by Dueñas’ curves (1538 vs. 811).
Mean birth weight in most weeks was less for infant girls than for boys, although the mean difference between the two sexes was only 84 g from week 35 to week 42. In the SGA group, a slight predominance of 0.5% was observed for infant boys.
Table 2: Weight distribution in newborn boys by gestational age (n = 7993)
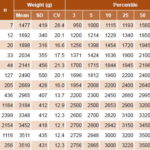
However, in the LGA group, there was a 1.5% predominance for infant girls over boys. The overall results (for both sexes) were 9.6% for SGA, 81.4 % for AGA and 9% for LGA. A comparison of the curves in Figures 1 and 2 indicates that in the 30–36 week group, both curves show the same percentage of SGA.
DISCUSSION
Timely detection of abnormal weight values for gestational age during intrauterine and neonatal development enables better risk assessment for possible early or subsequent disorders.[10,11]
Our study showed an average weight increase of 26.6% in infant girls and 29.3% in infant boys between weeks 36 and 41, surpassing the results reported by Dueñas (22.2% for both sexes).[31] A similar trend was also observed in studies by San Pedro in Argentina[23] and González in Chile[15] (38.4% and 32.8% respectively; again, for both sexes). The greater increases in mean weights over this period of intrauterine development are important in explaining these studies’ higher 10th-percentile values as compared with ours.
The cutoff point for P10 can vary, according to different authors (Ayerza,[27] Alarcón[14]), due to various factors, including study design, specific population characteristics, ethnicity and maternal characteristics (such as weight and height). These authors noted that boys’ birth weights tended to be higher than girls’, which is consistent with our findings. P10 values found by Lubchenco[12] were below those reported in studies by Ayerza,[27] González,[15] and Ticona;[19] Lubchenco detected only 2.2% of SGA for both sexes at week 40. The portion of SGA (9.1%) found in our study falls within the range of 7%–11% reported by Latin American authors such as Urquía,[18] Lagos[24] and Juez.[25]
Other studies presented higher cutoff points than ours for P10 at 36 weeks, but these were for both sexes combined. San Pedro of Argentina presented a cutoff point of 2190 g,[23] which was 10 g less than our equivalent cutoff for boys, but higher than ours calculated for both sexes combined. Hadlock in the USA found 2335 g,[2] the Latin American Center for Perinatology in Uruguay indicated 2324 g[39] and Alexander in the USA determined a cutoff point of 2354 g,[40] all values higher than either of our sex-specific cutoffs.
Variability in weeks 36 and 40 in both sexes in our study is consistent with that described by González, who found CVs of 16.6% and 12.1%, respectively, in those weeks,[15] and by Juez, who reported CVs of 13.9% at 36 weeks and 11.2% at 40 weeks.[25] CVs in our study approached stability as gestational age progressed.
It is important to note that the low number of neonates born in weeks 30–34 (5.6% of total neonates) is a possible source of bias in our study, and caution should be exercised in interpreting the values calculated for this gestational age. WHO’s technical report recommends a minimum of 200 cases for each week of gestation,[1] which is extremely difficult to attain in studies in perinatology services and areas with few births. In his work, Alarcón.[14] noted that the Chilean Pediatric Society, in establishing criteria for preparing such growth curves, recommended a minimum of 100 neonates for each gestational age. Our work meets this standard from week 35 on. In an attempt to solve this problem, some authors (such as Pittaluga) have designed curves based solely on neonates born at 36 weeks of gestation or earlier, for greater statistical efficiency.[32]
Our inclusion criteria were also very broad; neonates whose mothers had risk factors that could affect fetal weight (such as pre-eclampsia, hypertension and diabetes mellitus) were not excluded, which could introduce a negative bias in reporting SGA.[41,42] However, other researchers have also used this design, including González, who studied more than 2 million neonates in Chile without excluding fetal weight risk factors,[15] and Juez, also in Chile, who likewise included them.[25]
This study has enabled construction of weight percentile distribution curves and tables by gestation age (in weeks) and sex, specific to the population of Holguín Municipality, Cuba. It also fills an information gap since such curves were not previously available here.
CONCLUSION
Values were established for new reference weights by gestational age and sex, enabling formulation of percentile distribution curves and tables. Differences were found when our tables were compared with tables from other countries. The increased detection of newborns under P10 (SGA infants) enables clinical and epidemiological actions that can help reduce morbidity and mortality in this high-risk neonatal group.
ACKNOWLEDGMENTS
We are grateful to Dr Enzo Dueñas Gómez, the first Cuban physician to design weight curves and percentile distribution tables for newborn infants by gestational week and sex, for his guidance in the preparation of this paper.


