INTRODUCTION
Life expectancy for type 2 diabetics is 30% shorter than for non-diabetics, and their primary cause of death is cardiovascular disease, aggravated by the fact that the disease tends to appear silently and frequently leads to sudden death.[1] Multiple studies have demonstrated a prevalence of silent myocardial ischemia (SMI) in type 2 diabetics ranging from 9% to 57%.[2,3] Paradoxically, in this particular group of patients, there is early onset of ischemic heart disease (IHD) but late diagnosis, due to the absence of overt clinical signs.[2,3]
Alterations in blood lipid concentrations are a serious threat to type 2 diabetics. Several studies report a considerable decrease in cardiovascular complications and mortality in diabetics following treatment of dyslipidemia.[4,5] Previous studies have looked at the relationship between blood lipid levels and the presence of SMI, and several authors have described certain lipoproteins as independent predictors of IHD.[5,6] The lipid profile is a routine test for diabetic patients and even though the atherogenic pattern in type 2 diabetes mellitus (DM) is well identified, in which triglyceride levels increase and levels for cholesterol associated with high density lipoproteins (HDL) are below the normal reference range, blood lipids could provide the physician with a clue to the need for more sensitive studies for early detection of SMI.
Altered myocardial perfusion is one of the first manifestations of the ischemic cascade, which proceeds through a series of alterations until angina pectoris appears, the classic clinical manifestation of IHD, thus the importance of myocardial perfusion studies to detect ischemia in asymptomatic patients whose baseline electrocardiogram (ECG) and cardiac stress tests are negative.[7] These studies are even more valuable for early diagnosis, timely assessment and improved prognosis in type 2 diabetics, who frequently have damaged microcirculation.
Single-Photon Emission-Computed Tomography synchronized with ECG (gated SPECT or gSPECT) is a non-invasive technique that has demonstrated high sensitivity and specificity in acute coronary disease, with a predictive value of 95% to 100%. For chronic IHD, it has 87% sensitivity and 75% specificity.[8] The ability to perform myocardial perfusion tomography synchronized with the R segment on ECG permits assessment of perfusion and ventricular function in the same test.[7]
GSPECT contributes a functional perspective to the analysis of myocardial perfusion, while coronary angiography provides a precise description of the coronary epicardial tree, detecting the presence, degree and extent of anatomic stenosis. Images provided by cardiac imaging radiotracers reflect alterations in myocardial perfusion and therefore translate the functional impact of reduced arterial diameter. This feature fulfills several objectives, from diagnosis of IHD and followup with medical or surgical treatment, to stratification of risk in patients after acute myocardial infarction.[7]
Classification and regression tree (CRT) analysis provides both predictive and explanatory models[9] and is among the most frequently used statistical methods for identifying disease predictors. It involves an algorithm that produces binary trees, repeatedly dividing the data into two sets so that data in each subset are more homogeneous than in the previous set,[9] enabling detection of predictor or indicator cutoff points for a given disease.
In Cuba, DM is the sixth most common hospital discharge diagnosis and is among the ten leading causes of death, with a prevalence of 40.5 per 1000 population and a mortality rate of 13.2 per 100,000 population.[10]
Studies in the international literature have evaluated the predictive ability of risk factors for IHD;[11] however, it is important to study populations of different countries and their particular characteristics in relation to potential risk. Every population has its peculiarities, with varying dietary patterns, customs, economic opportunities, cultural levels and other factors.[1,11] There have been few Cuban studies to date of gSPECT in diagnosis of silent ischemia in high risk patients such as type 2 diabetics.[5] The objective of this study was to identify blood lipid levels predictive of SMI in a population of asymptomatic type 2 diabetics from several Havana health areas.
METHODS
A prospective, observational, analytical study was conducted from May 2005 through May 2009.
A group of 220 type 2 diabetic patients without clinical cardiovascular signs from ten family physician offices in Plaza de la Revolución and Playa municipalities (19 de Abril and Primero de Enero polyclinics in Havana) was assessed. All diabetics were examined in each clinic, but only those meeting specific criteria were included in this study.
Inclusion criteria Type 2 diabetics of both sexes, aged ≥18 years, without symptoms or previous diagnosis of IHD. All patients met American Diabetes Association criteria for cardiovascular disease screening (two or more major associated atherogenic risk factors).[12]
Exclusion criteria Pregnancy or breastfeeding, severe limitations or diseases impeding treadmill exercise, baseline ECG with complete left bundle branch block.
Ethical considerations The study was evaluated and approved by the ethics committee in each participating institution and written informed consent was obtained from all patients.
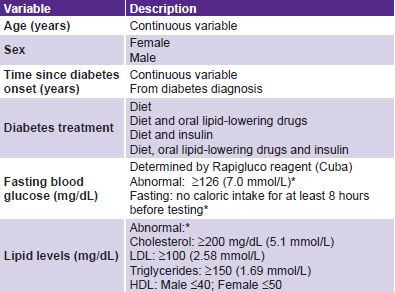
Study variables A clinical record was created that included personal data, information from an in-depth interview, and physical examination results. Laboratory tests were performed for fasting blood glucose and blood lipid levels—total cholesterol, triglycerides, low density lipoprotein (LDL) and high density lipoprotein (HDL)—the results recorded in the history. American Diabetes Association criteria were used for normative laboratory values (Table 1).[12]
Diagnostic tools gSPECT was performed with treadmill exercise using a modified Bruce protocol, according to American Society of Nuclear Medicine standards, under stress and rest conditions on different days.[13] Tomographs synchronized to the ECG monitor were performed one hour after intravenous injection of 1110 MBq (30 mCi) of 99mTc-MIBI (methoxy-isobutyl-isonitrile), using a Sopha DS7 single-head SPECT gamma camera (Sopha Medical, France). For each patient, the study involved 32 projections of 50 seconds each, in a 180-degree circular orbit; this used a low-energy, high-resolution collimator, 20% energy window centered at the 140-keV 99mTc photopeak. The studies obtained 256 images, with a 64 x 64 matrix. Images were processed on a Power Vision (SMV, Canada) workstation, using Emory Cardiac Toolbox software (Emory University, USA).[13]
Table 1: Study variables

* per American Diabetes Association, 2009[12]
Assessment of myocardial perfusion. Visual and quantitative examination was performed of vertical long-axis, horizontal long-axis, and perpendicular short-axis slices, as well as the 17 left ventricular segments on the polar map display, according to guidelines developed jointly by the American Heart Association, American College of Cardiology and Society of Nuclear Medicine.[13] Perfusion defects were assessed for extent, intensity, reversibility and involvement of one or more territories. They were classified as non-extensive (only one segment involved) or extensive (two or more segments involved). Intensity was reported as percentage uptake compared to the area of greatest uptake in the left ventricular polar image (mild defect, from 60% to 69%; moderate, from 50% to 59%; and severe, under 50%).[13] Reversibility was classified as total, partial or nil.
Positive gSPECT was defined by segmental or regional uptake defects involving at least two sectors, at less than 70% of maximum uptake level in the left ventricular polar image. Totally reversible ones were considered ischemic patterns; partially reversible ones were interpreted as areas in which scar tissue coexists or as intense ischemias. Defects with uptake of less than 30% or from 30% to 49% that did not change with rest were considered scars (necrotic).
Negative gSPECT was defined by absence of uptake defects of less than 70%. Slight defects that did not change on rest in the inferior and anterior region were interpreted as attenuations (diaphragmatic and mammary, respectively) and were considered negative.
Assessment of left ventricular function. The global left ventricular ejection fraction was computed; values of >50% were considered normal, according to Faber, et al.[14] Ventricular systolic wall thickening was assessed using cinematic display (visual) and parietal thickening map (quantitative). Regional wall motion was also assessed to detect functional alterations such as left ventricular akinesia, hypokinesia and dyskinesias.
Coronary angiography. This was performed only on gSPECT-positive patients. Quantitative angiography (femoral route) was used, and obstructions of ≥50% were considered clinically significant.[15]
Finally, SMI was defined by positive gSPECT results, with or without angiographic confirmation.
Statistical analysis. After testing, two groups were formed: gSPECT positive and gSPECT negative. Descriptive statistics (mean and standard deviation) were calculated in both groups for age, fasting blood glucose levels, length of time since DM onset and lipid levels. Means were compared using the Student t-test for independent data. P values of < 0.05 were considered significant. Classification trees were created using CRT analysis.[9] GSPECT results were included as a categorical dependent variable and lipid levels as continuous independent variables. Optimal cutoff points for indicators of silent myocardial ischemia were determined in the study population and independent variables were compared by obtaining normalized values. SPSS 15.0 statistical software was used to compute statistics.
RESULTS
Mean age of the 220 type 2 diabetics studied was 59.9±7.9 years. In the study population; 74.5% of patients were being treated with diet and oral hypoglycemic agents and 68.6% had had DM for more than five years.
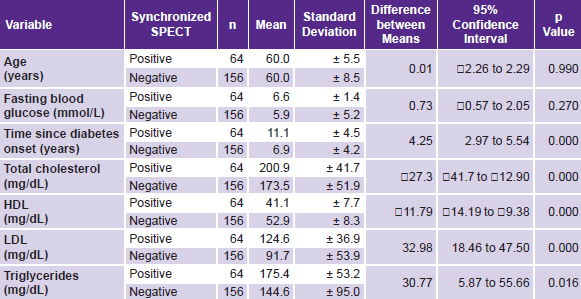
GSPECT was positive for SMI in 64 patients (29.1% of the study population) and negative in 156 (70.9%). As can be seen in Table 2, the groups did not differ with regard to age or blood glucose levels. Mean values for length of time since DM onset, total cholesterol, LDL and triglycerides were greater in gSPECT-positive diabetics (p < 0.05). Average HDL level was lower in this group (p < 0.05). Patients aged 50 to 59 years had the greatest percentage of SMI (56.3%).
Among gSPECT-positive patients, 68.4% had ischemia in two territories; 65% of ischemic defects were moderate or severe reversible defects (moderate and severe ischemia). In two cases, a non-reversible severe defect (necrosis) was reported. Functional analysis showed a lower mean ejection fraction in the group with ischemia (51% vs. 62%; p = 0.001). Figure 1 shows gSPECT images from a type 2 diabetic with SMI.
Table 2: Differences between gSPECT-positive and -negative type 2 diabetics (n=220; 109 female, 111 male)

LDL: Low-density lipoprotein HDL: High-density lipoprotein
In the 64 gSPECT-positive patients who underwent coronary angiography, 60 (27.3% of the total study population) were found to have stenosis of ≥50% in one or more coronary vessels. The remaining four cases had normal angiographic results (1.8% of the total study population); of these, one had no angiographic lesions and three had non-significant coronary lesions. Multivessel disease was found in 68.4% of the coronary angiographies.
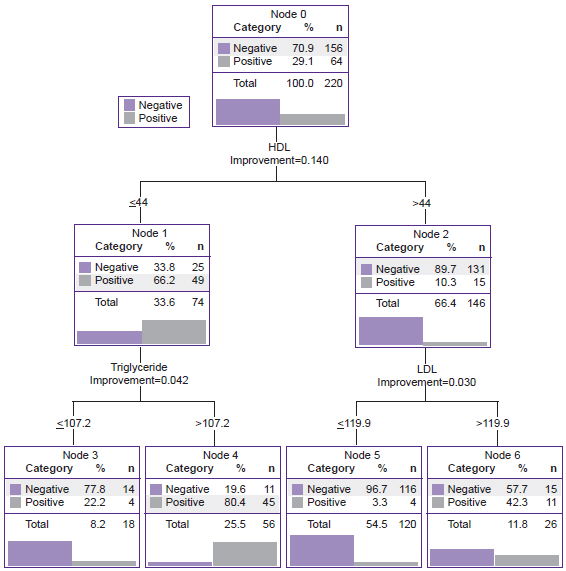
Figure 2 displays the classification tree relating gSPECT results to blood lipid levels of all type 2 diabetic patients included in the study. The model first generated a cutoff point of ≤44 mg/dL for HDL. Below this level, the percentage of patients gSPECT positive for SMI increased to 66.2%. The tree shows cutoff points for LDL of >119.9 mg/dL, and for triglycerides of >107.2 mg/dL. The combination of HDL ≤44 mg/dL and triglycerides >107.2 mg/dL was associated with the greatest increase in the percentage of patients with SMI (80.4%). Using the same statistical method, HDL was found to be the most important normalized independent variable for these combinations of factors.
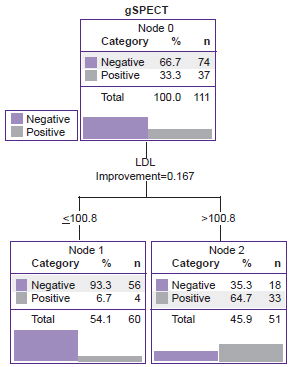
Figure 3 shows a second classification tree for men. Among male diabetics, 33.3% were gSPECT positive for SMI. In this case, the most important normalized variable was LDL>100.8 mg/dL; the percentage of SMI increased to 64.7% in diabetic men with higher LDL levels.
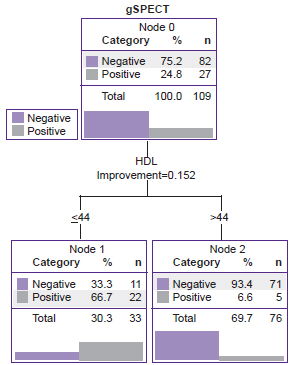
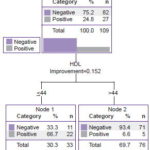
Figure 4 shows the classification tree for women. Among female diabetics, 24.8% were gSPECT positive for SMI. In this case, the most important normalized variable was HDL, with a cutoff point of HDL ≤44 mg/dL; among diabetic women, 66.7% with lower HDL levels had SMI.
Although gSPECT-detected SMI prevalence was slightly higher in men than in women, the difference was not statistically significant (p = 0.162).
DISCUSSION
Type 2 diabetics are at high risk for developing SMI,[1–3] so current international guidelines are geared toward early SMI detection and treatment in this particular patient group.[16,17] This study using gSPECT found substantial occurrence of ischemia in the population assessed, results that concur with those of other researchers[1–3,5] and affirm the need for an approach tailored to this subpopulation.
Over half the tests confirmed multivessel disease, indicating lesion severity. Similar results were obtained from gSPECT and angiography, the latter of which is the current gold standard for diagnosis of coronary disease.[8,18–20]
Figure 1: Gated SPECT of a 57-year old, male, asymptomatic type 2 diabetic
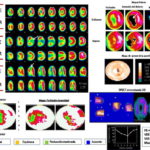
SA: short axis HLA: horizontal long axis VLA: vertical long axis S: stress R: rest EF: ejection fraction EDV: end diastolic volume ESV: end systolic volume.
Upper left: Tomographic slices post-stress (S) and at rest (R). Upper right, polar maps showing perfusion defect, defect extent and reversibility. Center right, map showing ventricular wall thickness. Lower left: Polar maps of stress, rest, and reversibility showing perfusion defect severity. Lower right, 3D image of endocardial border at diastole and systole, post-stress gated SPECT functional data: volume curve and values obtained. Arrows point to an extensive moderately-intense perfusion defect in the anteroseptal-apical region during stress, which in the rest of the slices is practically normalized (reversible defect), and a severe uptake defect in the inferior apicoseptal region during stress that improves without normalizing on rest (partially reversible defect). Both defects are indicators of ischemic lesions (moderate anteroseptal-apical ischemia and severe inferior apicoseptal ischemia), resulting from multivessel disease. Functional images show septal akinesia. Coronary angiography showed coronary tree lesions with stenosis of ≥70% in the anterior descending and right coronary arteries.
If angiographic studies are considered the gold standard, then four patients had false positive results from gSPECT. However, it is important to note that myocardial perfusion is a functional evaluation of the vascular bed in its totality, including the state of microcirculation, while angiography is an anatomic study that only provides information about the epicardial arteries.[19] Several studies have confirmed the high negative predictive value of gSPECT and consider coronary angiography unnecessary when SPECT is negative.[21–23] Hence, analysis of lipid factors in this study is based on gSPECT results.
Analysis of study variables found no important differences between gSPECT-positive and -negative groups in mean values for age and fasting blood glucose. This is probably related to the fact that the entire population consisted of type 2 diabetics under treatment and for whom age of disease onset was in the same range. However, the SMI group did have slightly higher fasting blood glucose levels. A limitation of this study was the absence of testing for glycosylated hemoglobin, indispensible for assessing blood glucose control.
Average time since DM onset was greater in patients with SMI. However, since the study focused on evaluating lipid levels as a predictor of risk for SMI, controlling for this variable was not indicated, since dyslipidemia may in part be associated with a longer time since disease onset. The results of the VERIFICA study precisely estimated the rate of coronary events at five years in diabetic patients, using the function adapted from REGICOR to calculate risk.[24] The Veterans Affairs Diabetes Trial provides another example of the influence of time since DM onset; it found that time from DM onset interacted with randomization in such a way that patients who had DM for under 12 years benefited from intensive control—decreasing their risk of cardiovascular disease—while those with a longer history of DM did not.[25]
Differences in lipid profiles between the two groups were considerable. gSPECT-positive diabetics had lower mean HDL levels than those who were gSPECT negative, while mean levels for total cholesterol, LDL, and triglycerides were higher in gSPECT-positive than in gSPECT-negative patients. These results are consistent with those reported by other studies demonstrating an important relationship between lipid alterations and SMI in type 2 diabetics.[1,5,6,26] For years now, international associations have recommended that optimal control in type 2 diabetes requires lipid levels lower than those considered normal in non-diabetics. Our results support the applicability of these recommendations in Cuba.
Two strengths of classification and regression trees are their simple graphical representation and the compact format of natural language rules. An analysis based on these offers some attractive characteristics: it permits identification of homogeneous groups at low or high risk and facilitates development of rules for making predictions about individual cases.[9]
CRT analysis used in this study permitted clear identification of optimal levels at which the percentage of patients with SMI in the study population began to increase. This dramatically changes the cost-benefit ratio for using more sensitive but costly diagnostic techniques, and we conclude that in our population, such techniques would be justified in assessment of type 2 diabetics who present with HDL ≤44 mg/dL and triglycerides >107.2 mg/dL
The cutoff points found, although not identical, did not deviate greatly from ranges established as risk levels by the American Diabetes Association.[12] However, although LDL and HDL cutoff values for SMI were slightly higher in our setting, predictive levels for triglycerides were clearly lower. These levels could be considered as suggestive of SMI in Cuban type 2 diabetics. Future research with larger populations will be necessary.
Some international authors have shown that in the general population, increased cholesterol is a much more important atherogenic factor than triglycerides, to the extent that hypertriglyceridemia is not unanimously considered to be a coronary risk factor.[6] However, it has been demonstrated that in diabetic patients, particularly in women, an increase in triglycerides is an important atherogenic factor,[4] which demonstrates that this group of patients requires separate analysis. In this study, total cholesterol was not an important predictor of SMI. The statistical method selected triglycerides as an important predictor for silent ischemia, coinciding with the results of other research.[5]
Figure 2: Classification tree using CRT statistical growth method, type 2 diabetics (n=220). Variable with highest z-score: HDL
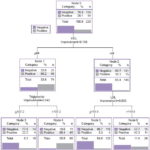
Figure 3: Classification tree using CRT statistical growth method, male type-2 diabetics (n=111). Variable with highest z-score: LDL

Figure 4: Classification tree using CRT statistical growth method, female type-2 diabetics (n=109). Variable with highest z-score: HDL
HDL was the most important normalized variable for the total population and for female diabetics. Several authors have reported low HDL levels in diabetic patients,[5,6,27–30] and some have proposed HDL as an independent marker for atherosclerosis and myocardial ischemia.[6,7,26,27] Other researchers have found a significant difference in HDL levels between diabetic patients with SMI and those without, and have demonstrated that HDL can be an independent predictor of IHD.[28]
Another optimal cutoff point indicative of SMI was LDL >100.8 mg/dL, which in men is the most important variable. For many years, LDL has been considered the principal lipid marker for estimating cardiovascular risk in type 2 diabetic patients. The same elevated LDL cholesterol level triples cardiovascular risk in diabetics in comparison with the non-diabetics.[29,30] The results of a meta-analysis of 14 randomized trials of statin therapy by the Cholesterol Treatment Trialists’ Collaboration, showed that a one mmol/L decrease in LDL reduces the risk of major vascular events (myocardial infarction or coronary death, stroke, need for coronary revascularization) in approximately one fifth of high-risk patients, independent of initial lipid profile or other characteristics. Among all participants with DM, the proportional reduction in major vascular events per mmol/L decrease in LDL was similar, independent of history of vascular disease, sex, age, treated hypertension, body mass index (BMI), systolic or diastolic blood pressure, smoking and glomerular filtration rate.[30] The foregoing affirms the importance of intensive treatment of dyslipidemia in type 2 diabetic patients to prevent development of cardiovascular disease and concurs with our finding that SMI is more frequent in type 2 diabetics with LDL levels above the thresholds identified by the American Diabetes Association.
The most important finding emerging from analysis by sex was a somewhat greater frequency of SMI in men than in women. For the past several decades it has been stated that men have a greater risk for developing cardiovascular diseases.[5] SMI predictive cutoff points by sex differed little from those of the total population; although in men, levels of the most important normalized variable (LDL) were somewhat lower than those in the total study population. In women, predictive values for HDL were identical to those for the total study population.
Previous studies have evaluated blood lipid levels in relation to sex and age. Suka et al. studied the influence of sex, age and BMI on total cholesterol levels[31] and affirmed that average total cholesterol levels varied substantially with age in men and in women. In that study, LDL levels were significantly associated with age and BMI in participants of both sexes. Prevalence of LDL≥160 mg/dL was greatest in men aged 50 to 59 years and in women aged 60 to 69 years.
The results of the Suka study could explain why the most important normalized variables differed between men and women in our study, in which average age was similar for both sexes. Patients aged 50 to 59 years had the highest percentage of cases of SMI. In this age group, men had higher LDL levels than women, and LDL was the most important independent variable for men, while HDL was for women. The effect of menopause on lipid metabolism may also be involved; lack of information on menopausal status constitutes a study limitation.
Other studies, like ours, have explored health issues using classification and regression trees,[9,32–34] with interesting results. This statistical method can be employed with all types of predictor variables—binary, nominal, ordinal, interval and ratio—facilitating their use, which is why it is becoming more common in medical research. It must be remembered that the combination of factors identified in this study is not necessarily the only one, but is optimal according to the logic of the algorithm that was used to develop this model. This is another limitation of our study, upon which future studies could improve.
A substantial contribution of this study is the fact that for the indicators included (blood lipid levels), some optimal cutoff points were observed that were predictive of SMI. These cutoff points are specific to the study population, contributing to knowledge on this subject in the Cuban diabetic population. Additionally, it was possible to determine combinations of changes in lipids conferring a notable increase in SMI risk; if confirmed in future studies in larger populations, these would provide a non-invasive method to detect SMI in this subpopulation.
CONCLUSIONS
The combination of low HDL and elevated triglycerides was a strong predictor for SMI in a population of type 2 diabetics and the condition was present in a substantial proportion of participants. The authors recommend confirmation of these findings with further studies in larger populations of type 2 diabetics.