INTRODUCTION
Climatic conditions in the Cuban archipelago are determined by its geographical position close to the Tropic of Cancer, where it receives high levels of solar radiation throughout the year. The country’s long, narrow profile and maritime situation temper the behavior of the main climate variables. Cuba’s climate is tropical and seasonally humid, with semicontinental features due to its proximity to North America.[1] It has two well-defined seasons: a summer rainy season (May–October), influenced by ocean weather systems; and a winter dry season (November–April), with greater influence by continental high pressure systems and cold fronts.
Weather (temperature, humidity, atmospheric pressure, precipitation conditions) and climate (long-term average weather conditions) can affect natural, human and socioeconomic systems, with consequences for human health.[2] Local climate characteristics can affect population morbidity and mortality; e.g., the pronounced seasonal variation may account for an acute myocardial infarction (AMI) mortality rate higher in winter than in summer.[3,4] Human capacity for adaptation and self-regulation through homeostasis enables us to adapt to diverse climates and environments, but we remain vulnerable to major shifts in extremes of meteorological and climatic conditions (hotter or colder, wetter or drier) or to abrupt climate changes that may exceed our physiological ability to adapt.[5]
Current climate variability, instability and changes in atmospheric circulation patterns, such as El Niño and La Niña events, are having an impact on the environment with adverse effects on health, and potential consequences for life on Earth.[6,7]
AMI is a health problem of global importance and one of the leading causes of morbidity and mortality.[8,9] For several years now, AMI has been one of the leading causes of death in Cuba, with mortality rates ranging from 197.6 to 211.8/100,000 population from 2009 to 2012.[10,11] In Cuba, as in the rest of the world, AMI mortality is higher in urban settings, in provincial capitals, urban, and urban-rural municipalities.[12,13] It is still not clear, however, how weather variations and climate change affect AMI mortality patterns, since other powerful determining factors make it difficult to detect smaller changes attributable to climate variability.[1]
The seasonal rhythm of AMI mortality is well known.[3,4,14–21] Prominent peaks occur in the coldest months of the year, and secondary peaks in the warmest months.[22–24]
Cuba’s climate has changed in the last 40 years, bringing weather anomalies of varying intensities. The country has seen a 0.9 °C increase in mean annual temperature since 1951, a pronounced increase in minimum temperatures (of around 1.9 °C), a decrease in daily temperature range, and increased frequency and intensity of extreme events (drought, heavy rains, hurricanes, and both unusually cold and unusually hot months).[25] Projections estimate more extreme climatic conditions, with mean temperature increasing by as much as 4 °C, annual precipitation decreasing by >20% by the year 2050 and drought and extreme precipitation events increasing in frequency and intensity. Based on medium-range climate projections, warmer and wetter winters are expected, with large temperature and precipitation contrasts, along with warmer summers with greater temperature and humidity contrasts.[1] These changes may in fact create favorable conditions for an increase in AMI mortality, with greater variability in the winter months.[26]
There has been limited applied research on climatic impact on human health in Cuba. Temperature is one of the most-studied variables, but temperature does not act alone. At a given moment, the human body is exposed to a set of particular atmospheric conditions, a complex of meteorological variables (humidity, pressure, precipitation, etc.), with their effect depending on each individual’s relative susceptibility.[26]
Since Havana has Cuba’s highest rates of AMI mortality;[10,11] it would be useful to know which predisposing climatic factors are involved, if any; which among them are most influential; and at what times of year they have a greater impact. Our objective in this study is to describe the relationship between climate variability and AMI mortality in Havana Province (known as Havana City Province until 2010) over the period 2001–2012.
METHODS
An ecological time-series study was conducted[27] of the universe of 23,744 AMI deaths in people of both sexes (I21–I22 in the ICD-10) having their official residence in Havana Province during the period January 2001–December 2012, inclusive. Data on cause of death were taken from medical death certificates. Individual characteristics for the studied variables of sex, date of death, place of residence, and underlying cause were taken from the National Medical Records and Health Statistics Bureau of the Ministry of Public Health. Population data were obtained from the National Statistics and Information Bureau.[28] Number of deaths per month was used as a dependent variable to assess correlation with the Bultó-1 climatic index.[2]
Study area The study area comprised the current Havana Province, which is located between latitude 22°58’ N and 23°10’ N and between longitude 82°30’ W and 82°06’ W, and covers a land area of 726.75 km2.[29] Its geographical boundaries are the Straits of Florida to the north, Mayabeque and Artemisa Provinces to the south, Mayabeque Province to the east, and Artemisa Province to the west.
From the database of the Climate Center at the Institute of Meteorology, climate data were obtained for the four weather stations considered by meteorologists to be representative of the study area, although not all are actually inside its borders: Casa Blanca, in Havana Province, representing the northern coast; Bauta, in Artemisa, representing the west end of Havana Province; Tapaste, in Mayabeque, representing the east; and Santiago de las Vegas, in Mayabeque, representing the south. Variables were mean maximum temperature, mean minimum temperature, mean relative humidity, atmospheric pressure, water vapor pressure, total precipitation, number of days with precipitation, and temperature range.
Data processing and analysis The Bultó-1 index (which describes climate variations and trends, based on integration of the above-named climate variables) was used to describe climate variability for the study area.[2] This index defines the signals of the basic seasonal climate variations that characterize Havana’s climate and their dynamics in space and time: the rainy season (warmer and wetter) when index values are positive, and the dry season (cooler and dryer) when values are negative. Factor analysis was used to determine which variables best explained climate characteristics and their association with AMI. Time-series analyses were used to determine the different signals of seasonal and interannual variation. Mann-Kendall and Pettitt statistical tests were used to characterize mortality trends.
To validate reporting of AMI as underlying cause of death, a thorough review of the data obtained was carried out to search for over-recording, to eliminate duplicate cases, and to include only residents in the selected area. An ACCESS database was created with reliable, high-quality information for the following fields: sex, date of death, place of residence, and underlying cause of death. Descriptive and inferential statistics were applied, using STATISTICA 7.0, EXCEL, and Winstat 2.0 software.
A time-series analysis was performed to determine the different signals of seasonal and interannual variation and to adjust time-series models with nonconstant variance for simulation of mortality patterns with STATISTICA 7.0. This application was also used to produce box-and-whisker plots for assessing the relationship between monthly AMI death rates and climate variability. Monthly mortality trends were analyzed using graphic output from the Winstat 2.0 program.
Factor analysis was used to study the interrelationships between the variables that make up the Bultó-1 index and AMI mortality, stipulating eigenvalues >1 and that the factors selected explain >70% of variance. To analyze the annual trend, the Winstat 2.0 program was used to run two nonparametric tests: Mann–Kendall and Pettitt,[30] the latter to identify possible structural changes in the series. A significance level of p ≤0.05 was used for both tests.
RESULTS
AMI mortality behavior and trends In the period studied, a total of 23,744 AMI deaths were reported in Havana, for a mean annual rate of 91/100,000 population. Sex-specific rates were 104/100,000 in men and 79/100,000 in women.
A downward trend for deaths in men began in 2007, with a mortality rate of 109/100,000 population, reaching a low point of 80 in 2012. A less pronounced, but similar trend was seen for women, though with lower rates: in 2007 (80/100,000) and in 2012 (59/100,000).
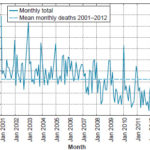
Figure 1 shows the decrease in monthly deaths below the series mean starting in 2007, more pronounced starting in 2009.
Figure 1: AMI deaths in Havana, 2001–2012
AMI: acute myocardial infarction
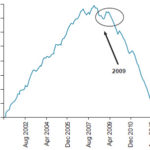
Figure 2 displays the Pettitt test values, showing a statistically significant (p ≤0.05) downward trend in AMI mortality starting with a change point in April 2009. The results for the forward–backward Mann-Kendall were the same.
Figure 2: Monthly AMI mortality trend, Havana, 2001–2012
AMI: acute myocardial infarction
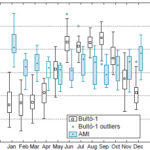
Seasonal AMI patterns Mortality values were highest during the dry season that occurs during the Cuban winter months (November–April). The highest rates are in the months of January and December, the peak occurring in January, while the lowest mortality is found in the rainy season (May–October), with minimum values in the two-month April–May period (Figure 3). As inferred from factor analysis, pressure and temperature range were the most influential elements for the climate–AMI mortality relationship, with values other than 0 (process mean or breakeven point). The remaining variables were complemented with factor 2 (Figure 4).
AMI mortality response to climate variability The response of AMI mortality to climate variability—expressed by the Bultó-1 index—is seen in the inverse relationship between index values and total AMI deaths. That is, when the index reached negative values below 1.5 in winter, AMI mortality increased, and when positive values were greater than 1.0 in summer, the number of deaths decreased. However, lower AMI deaths in summer were reported starting in 2011, with index values between 0 and somewhat higher than 0.5. This inverse association can explain the seasonal rhythm seen in AMI deaths (Figure 5).
Figure 3: Seasonal AMI mortality related to climate variability (Bultó-1 index), Havana, 2001–2012
AMI: acute myocardial infarction
Figure 4: AMI mortality and contribution of climate variables on the factor plane based on the Bultó-1 index
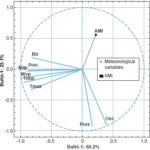
Ndp: Number of days with precipitation Osc: Temperature variation
Prec: Precipitation Pres: Pressure
Rh: Relative humidity Tmin: Minimum temperature
Tmax: Maximum temperature Wvp: Water vapor pressure
In almost all cases, the highest AMI peaks occurred in January, except in 2007 and 2008, when they occurred in the months of November and December respectively. Mortality started to increase in November and December, reaching a peak in January. In April, deaths began a gradual decrease that continued until the months of July and August, when they reached secondary peaks, though not as pronounced as those in January.
DISCUSSION
Overall, a stable trend was seen from 2001 to 2006, and mortality rates began to decrease in 2007, influenced not only by climate variability anomalies (from winters that were warmer and less intense than usual, to feeling cold, even very cold) but also because of a reduction in acute phase mortality, due to a variety of factors, including earlier diagnosis of infarction, early and aggressive treatment, proper reperfusion treatment and more accurate delineation of postinfarction risk, along with more appropriate treatment of heart failure and post-infarction mechanical complications.[31,32]
Concerning the statistically significant downward trend observed with the change point in the AMI mortality series starting in 2009, it could be supposed that in the last two years it has been oscillating around its mean. The trend pattern by year shows an increase from 2001 on, until the downward trend appeared in 2007, with slight variation in the last years. This might be associated, from a climate perspective, with significant weather and climate anomalies causing background bioclimatic conditions favorable to an increase in morbidity and mortality from many weather-sensitive diseases, including AMI. Of course, other factors or mechanisms linked to human behavior and not addressed in this study may have greater or lesser validity as a cause of mortality.
Figure 5: AMI mortality response to climate variability represented by the Bultó-1 index
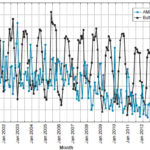
Influence exerted by the seasonal climate pattern, described by the Bultó-1 index, on AMI behavior was associated with greater mortality in dry-season months (November–April), peaking in January, characterized by colder and dryer climatic conditions with greater thermal contrasts and high pressure.[3,26] In the rainy season (May–October), a relative maximum mortality was seen from June to August, under drier, extremely warm climate conditions, less contrasting or variable, with a relative increase in atmospheric pressure associated with strengthening of the oceanic anticyclone. In the transition months (April and November) between the two seasons, no notable changes were observed in mortality, which could be associated with the expansion of summer weather into the transitional periods.
Analysis of the monthly distribution of deaths showed that the highest concentration of annual mortality occurred during the dry season (November–April), which is wintertime in Cuba. Other studies are consistent with these findings, describing a seasonal variation in the increase in cardiac mortality associated with winter months in the United States, Europe, and Asia.[17,33–39] The increase in coronary event rates during cold periods is more pronounced in warmer than in colder climates.[36] Other associated contributors are higher oxygen pressure, wetter conditions, cooler conditions and precipitation different from the usual rainy season in either frequency or intensity.[40]
The elements that compose the Bultó-1 index help to explain the relationship with AMI deaths. Pressure plays an important role. Low humidity also stands out as a predisposing parameter, particularly water vapor pressure. Dry air is infrequent in Cuba, occurring only with the arrival of dry and cold polar air masses, combined with extreme maximum and minimum temperatures. Conditions of high oxygen density increase AMI risk, affecting individuals differently according to their age, health status, lifestyle, and other environmental variables.[40]
Lack of precipitation and high temperatures cause changes in body temperature, respiration, heart rate, and blood circulation, as the body’s metabolism and nervous system adapt. These changes can be severe and may contribute to increased AMI mortality.[21,38,40] When body temperature exceeds an upper threshold, thermolytic effector responses (sweating, increased peripheral blood flow) are activated and, when it falls below a lower base value, thermogenic responses (reduced peripheral blood flow, chills) are initiated. The consequences of these changes depend on their intensity and on individual resilience. In several of the years of the period under study, some months were among the hottest since 1951 and there were deficits in total accumulated rainfall.[41–44]
The increase in AMI mortality during the early part of the study period could be associated with significant weather and climate anomalies that occurred in the Cuban archipelago, especially during winter months when it was largely subjected to the influence of El Niño–Southern Oscillation, and its counterpart, La Niña. These caused disturbances in weather and climate measurements that resulted in highly contrasting abnormal conditions, from persistence of very cold, dry days, particularly in January, to summers that were either very hot and humid or dry, with persistently high values in extreme temperatures (small temperature range).[41,42]
High ambient humidity hinders the body’s ability to cool off through sweat evaporation. In situations of intense heat when the body most needs this mechanism to release heat, sweat takes longer to evaporate, requiring more sweating. Small increases in temperature can seriously affect people. In Cuba, the mean annual temperature has risen by nearly 0.9 ºC since 1951, and it is estimated that by 2100 it will have risen by between 2.7 ºC and 7 ºC. These temperature increases would contribute to an increase in AMI incidence.[20,24]
With the more severe impact of a cold front (polar air mass) in winter, radiative exchange decreases, sweating stops, and cold stress on the body’s thermoregulatory system increases, the opposite of what happens in summer. In winters with extended periods of warmer temperatures, people maintain their adaptation to heat, and each blast by a cold front is felt more keenly. The most vulnerable population groups, the sick and elderly, have limited capacity to respond to persistent severe weather.[4,39,42]
January 2001, the month with the highest AMI mortality, was the coldest since 1982 and one of the coldest since 1951, with strikingly low minimum temperatures (3.8°C).[45] Something similar occurred in 2003 and 2010, when successive January cold fronts accentuated winter conditions, with persistently low minimum temperatures and little temperature variation.[45] During the summer months in general, mean temperatures remained well above normal over the period, with high extreme temperatures and humidity.[42,43] The hot months were preceded and followed by extremely cold winter months. During transition periods, conditions were closer to normal. These assertions are consistent with other studies that also found physiological effects of climate, beyond the direct impacts of extreme climate events on health.[46]
This study had several limitations, including not having examined mortality in the age groups at greatest risk for AMI, and not having included such determinants as behavior, lifestyle, and prevalence of heart disease and hypertension (as well as other risk factors for cardiovascular disease by municipality). Furthermore, mortality as a dependent variable may be less susceptible to the impact of climate conditions than incidence, since access to and quality of health services can substantially affect survival.
This study is important, however, because only a few studies in Cuba and abroad have assessed the combined influence of a number of climatic factors on AMI; almost all studies to date have explored the impact of specific variables, such as rain and temperature. Another contribution made by this study is its demonstration of the applicability of the Bultó-1 index to studies of climate variability and change in relation to AMI mortality.
CONCLUSION
The Bultó-1 index is applicable to studies of climate variability and acute myocardial infarction mortality. Climate variability is inversely associated with an increase in acute myocardial infarction mortality. This inverse relationship helps explain the seasonal pattern of acute myocardial infarction mortality.


