INTRODUCTION
The rising prevalence of overweight and obesity in children and adolescents has been widely reported in both developed and developing countries, and is generally recognized as a serious public health problem. Several studies have demonstrated the association between excess weight in young children and development of chronic non-communicable diseases, including hypertension, dyslipidemia, hyperinsulinemia and orthopedic disorders, as well as frequent psychosocial problems leading to ostracism, low self-esteem and diminished quality of life.[1–6]
Given the serious implications of these findings for population health, monitoring of overweight and obesity trends beginning in early childhood is recommended. In Cuba, periodic population-based growth and development surveys have been conducted by the Ministry of Public Health since the early 1970s to monitor changes in the physical development and nutritional status of children and adolescents aged ≤19 years.[7–9] In these studies, Body Mass Index (BMI) was used to determine overweight and obesity, and left mid-arm fat area (MAFA) was used as an adiposity indicator.
Although childhood obesity may be defined in various ways, at the population level BMI is generally considered the most useful indicator, given that it is relatively easy to obtain and its use and cutoff points for diagnosing obesity and overweight in adults are well established.[10,11] In children, however, standard cutoff points cannot be used for all ages, since BMI changes substantially with physical growth and development.[12]
Pediatric BMI cutoff points must therefore be set by applying a uniform criterion at different ages. Since there is theoretically no pediatric BMI cutoff point indicating a sharp increase in risk to health, some authors have used specific percentiles that, at the end of adolescence, result in BMI values similar to those used to diagnose overweight and obesity in adults (25 kg/m2 and 30 kg/m2, respectively). In the United States, age- and sex-specific 85th and 95th BMI percentiles have been proposed, while in Cuba, the 90th and 97th percentiles are used.[13–15]
BMI is only an indirect indicator of adiposity, since body mass is made up of different components, each of which may influence an individual’s weight differently. Therefore, changes in BMI do not necessarily reflect changes in body fat.[16] Ideally, diagnosis of excess body fat should be based on direct measurements, but the most precise techniques used for this assessment are difficult to apply in epidemiological studies. Anthropometric measurement of skinfold thickness in different parts of the body appears to be a viable alternative, and MAFA has been proposed as a more precise adiposity indicator than isolated skinfold thickness measurements.[17,18]
The objective of the present study is to estimate the prevalence of overweight, obesity and high adiposity in children and adolescents (aged ≤19 years) in Havana, Cuba, in 1972, 1993 and 2005, and describe secular trends of these conditions in 3 periods: 1972–1993, 1993–2005, and 1972–2005.
METHODS
A retrospective, descriptive study was based on examination of data from growth and development surveys conducted in Havana in 1972, 1993 and 2005 (Table 1). The 1972 survey was a national study using representative samples of the Cuban population aged ≤19 years in all provinces (Total N=51,177; Havana N=7847); details of the sampling methods and principal results have been published.[19] The 1993 and 2005 surveys were provincial in scope and included Havana City Province (N=4331 and N=3913, respectively).[8,9]
Table 1: Survey Samples by Age, Sex and Survey Year
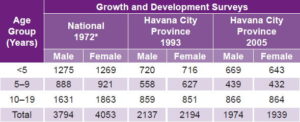
*Havana City Province sample Source: Human Growth and Development Department, Medical University of Havana, Cuba
Samples and data All 3 surveys used probabilistic sampling and comparable methods of data verification, processing, and analysis. Anthropometric measures included weight, height, arm circumference (AC) and triceps skinfold thickness, which were used, respectively, for obtaining Body Mass Index [weight in kg/(height in m)2] and left mid-arm fat area [AC (cm)]2/4π − [AC (cm) − πTriceps skinfold (cm)] 2/4π. Measurements were made using high precision equipment following International Biological Program technical guidelines.[20]
Definitions of overweight, obesity and high adiposity For the present study, excess weight was divided into 2 categories: overweight and obesity. Overweight was defined as a BMI value in the 90–97th percentile range, while obesity was defined as a BMI value >97th percentile.[15] In the Cuban population, at age 19 these percentiles are equal to 24.3 kg/m2 and 26.7 kg/m2, respectively, in males and 25.5 kg/m2 and 29.0 kg/m2, respectively, in females. These values make acceptable diagnostic cutoff points for Cuban children and adolescents, given their proximity to cutoff points used internationally to diagnose overweight and obesity in adults (25–29.9 kg/m2 and ≥30 kg/m2, respectively).[21] A MAFA value >90th percentile on the Cuban scale was used as the cutoff point for estimating prevalence of high adiposity.[22]
Statistical analysis Descriptive statistics were used to calculate percentages of the population surveyed in each nutritional status category, by sex, age group (early childhood: <5 years; childhood: 5–9 years; and adolescence: 10–19 years), and survey year (1972, 1993, 2005). Trends were established by comparing the proportions of individuals in each category by survey year. Differences between prevalences and their 95% confidence intervals (CI) were then calculated as follows:
CI = (p1−p2) ± ½(W12 + W22)½
where pi is the estimated prevalence in survey years under comparison and Wi is the range of their respective confidence intervals. If CI did not include zero, the difference was considered significant at 95% CI.[23] All analyses were done using SPSS statistical software for Windows, version 8.0.
RESULTS
Estimated prevalence of overweight and obesity in children and adolescents in Havana declined sharply between 1972 and 1993, and increased between 1993 and 2005. Prevalence of high adiposity, however, showed slight overall change between 1972 and 1993, but rose significantly after 1993, and by 2005 was double its 1972 value. Prevalence of overweight in the study population was 9.9% in 1972, 7.2% in 1993 and 10.5% in 2005, while obesity prevalence was 5.4%, 2.4% and 5.9% in the same survey years. Prevalence of excess weight (overweight + obesity) was 15.3% in 1972, dropping to 9.6% in 1993 and rising to 16.4% in 2005.
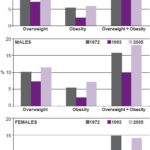
In all 3 survey years, excess weight was more prevalent in males than females, and prevalence in males was significantly higher in 2005 than in 1972 (18.6% and 15.7%, respectively). Although prevalence of excess weight in females declined between 1972 and 1993 and then rose again, in 2005 it remained slightly below its 1972 value (14.1% and 14.9%, respectively) (Figure 1).
Figure 1: Prevalence of Overweight, Obesity and Excess Weight by Sex and Survey Year
In the early childhood group, overweight prevalence dropped from 8.1% in 1972 to 7.8% in 1993, rising to 10.4% in 2005. Obesity prevalence, however, was cut almost in half from 6.1% in 1972 to 3.2% in 1993, and then rose only slightly to 3.7% in 2005. Taken together, despite the decline observed in 1993, prevalence of excess weight in this age group was basically the same in 2005 as in 1972 (14.1% and 14.2%, respectively).
Similar trends were observed in the childhood and adolescent groups. Prevalence of overweight in children aged 5–9 years dropped from 10.8% in 1972 to 7.1% in 1993, rising to 11.0% in 2005. In the same periods, obesity prevalence was 7.1%, 2.6% and 8.4%, and excess weight dropped from 17.9% to 9.7%, rising to 19.4%. In adolescents, overweight prevalence was 10.7%, 6.8% and 10.3%; obesity 4.0%, 1.6% and 6.2%; and excess weight 14.7%, 8.4% and 16.5%.
In 1972 and 2005, prevalence of all 3 weight categories was highest in the group aged 5–9 years, while in 1993, such prevalence was highest among children aged <5 years and lowest in adolescents (Figure 2).
Figure 2: Prevalence of Overweight, Obesity and Excess Weight by Age Group and Survey Year

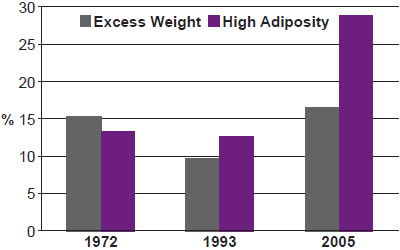
Prevalence of high adiposity followed exactly the same trend but with significantly greater increases after 1993, more than doubling its previous values in 2005 (28.8% compared to 13.3% in 1972 and 12.7% in 1993). In general, high adiposity was slightly more prevalent in males than females (Figure 3) and tended to decrease with age, except in 1972 when prevalence was lowest among children aged <5 years (Figure 4).
Figure 3: Prevalence of High Adiposity by Sex and Survey Year

Figure 4: Prevalence of High Adiposity by Age Group and Survey Year

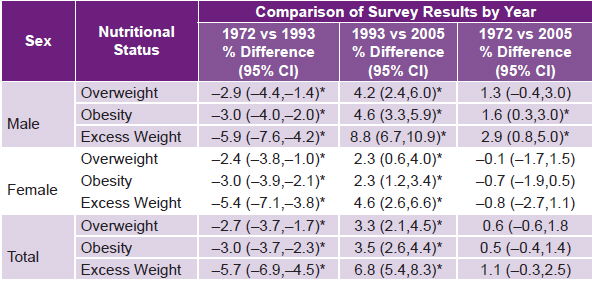
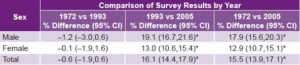
Differences in prevalence of overweight, obesity and excess weight were statistically significant between 1972 and 1993, and between 1993 and 2005, in both sexes and in the overall study population. When comparing prevalences between 1972 and 2005, however, none of the differences in prevalence in females were significant, and in males, only differences in obesity (1.6%; 95% CI 0.3,3.0) and excess weight (2.9%; 95% CI 0.8,5.0) were significant (Table 2).
Table 2: Prevalence of Overweight, Obesity and Excess Weight in Population ≤19 Years by Sex and Survey Year

Excess Weight = Overweight + Obesity * Statistically Significant Source: Human Growth and Development Department, Medical University of Havana, Cuba
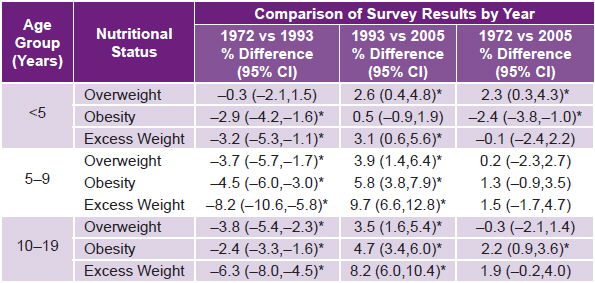
When analyzed by age group, differences in overweight, obesity and excess weight in 1972–1993 and 1993–2005 were significant in all age groups with the exception of the reduction in overweight prevalence in children aged <5 years in the former period (−0.3; 95% CI −2.1,1.5) and the increase in obesity prevalence, also in children aged <5 years, in the latter period (0.5; 95% CI −0.9,1.9). Between 1972 and 2005, the only significant differences were the increase in overweight prevalence (2.3%; 95% CI 0.3,4.3) and the reduction in obesity prevalence (−2.4%; 95% CI −3.8, −1.0) in the early childhood group, as well as the increase in obesity prevalence in adolescents (2.2%; 95% CI 0.9, 3.6) (Table 3).
Table 3: Prevalence of Overweight, Obesity and Excess Weight in Population ≤19 Years by Age Group and Survey Year
Excess Weight = Overweight + Obesity * Statistically Significant Source: Human Growth and Development Department, Medical University of Havana, Cuba
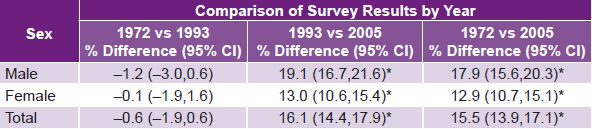
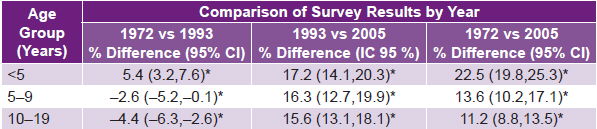
Reductions in the prevalence of high adiposity between 1972 and 1993, overall and by sex, were not significant, while increases in 1993–2005 and 1973–2005, overall, in both sexes and all age groups, were significant (Table 4). In 1972–1993, only children aged <5 years exhibited an increase in high adiposity, which was significant (5.4%; 95% CI 3.2, 7.6), as were reductions in the other age groups in the same period (−2.6; 95% CI −5.2, −0.1 in children aged 5–9 years, and −4.4; −6.3,−2.6 in adolescents) (Table 5).
Table 4: Prevalence of High Adiposity in Population ≤19 Years by Sex and Survey Year

* Statistically Significant Source: Human Growth and Development Department, Medical University of Havana, Cuba
Table 5: Prevalence of High Adiposity in Population ≤19 Years by Age Group and Survey Year

* Statistically Significant Source: Human Growth and Development Department, Medical University of Havana, Cuba
The drop in prevalence of high adiposity from 1972 to 1993 was relatively smaller than the reduction in excess weight, and its increase from 1972 to 2005 was greater, showing similar trends in both BMI and MAFA but of a different scale. While in 1972, excess weight was more prevalent than high adiposity in the overall study population (15.3% and 13.3%, respectively), the 1993 study showed a reverse trend (9.6% excess weight vs.12.7% high adiposity) that continued in 2005 (16.4% excess weight vs. 28.8% high adiposity) (Figure 5).
DISCUSSION
The relatively minor increase in the prevalence of excess weight in the study population between 1972 and 2005, compared to the significant and much higher increase in the prevalence of high adiposity over the same period, indicate a growing trend in which the presence of excess fat predominates over excess body weight. In other words, high adiposity affects a portion of children and adolescents in Havana whose BMI falls within normal limits (using local reference values).
This raises serious concerns, since Cuban Ministry of Public Health official data show increased prevalence of chronic non-communicable diseases, such as diabetes and hypertension, in young people aged 15–24 years in Havana City province in 1995–2005.[24] The trends detected in the behavior of BMI and MAFA in this study, particularly in 1993–2005, may therefore indicate serious immediate consequences for the health of that population group and should be closely monitored.
Analysis of these trends is particularly difficult, given the many complex factors influencing nutritional status at the population level. Several studies have shown that rates of secular change in weight and body mass may vary with socioeconomic changes in a specific population.[4–6] Trends similar to those observed in this study have also been reported in association with different stages of nutritional transition in other populations with diverse levels of socioeconomic development.[25–27]
During the periods examined in the present study, major changes in lifestyle and eating habits occurred in Cuba—and specifically in Havana City Province—which help explain the results obtained. With the collapse of Cuba’s primary trading partners, the Soviet Union and the European socialist block countries, in the early 1990s, availability of oil, raw materials, imported food and most essential items was abruptly and drastically reduced. This situation, exacerbated by tightening of the prolonged economic blockade by the United States, resulted in food shortages, and, in turn, lowered overall nutritional intake in the Cuban population from 108.5% of recommended energy allowances in 1972 to 70.2% in 1993, and reduced recommended protein intake from 98.6% to 66.7% in the same period.[28] At the same time, lack of transportation due to a generalized fuel shortage led to increased physical activity in the population at large.
Reductions in all indicators analyzed in this study in 1972–1993 (with the exception of increased prevalence of high adiposity in the early childhood group) suggest the major impact of these changes in nutritional intake and physical activity on children and adolescents in Havana during that time.
As economic recovery began in the late 1990s, food availability in Cuba improved. By 2005, nutritional intake had risen to 135.2% of recommended energy allowances for the general population and 114.6% of the recommended protein allowances,[28] and, as transportation also improved, physical activity declined. This transition was accompanied by increased availability of other goods associated with more sedentary lifestyles, particularly computers and electronic games. Altogether, the changes from 1993 to 2005 can be regarded as conducive to a growing imbalance between caloric intake and energy expenditure, leading to the significant increases observed in overweight, obesity and excess weight, particularly in males, children aged 5–9 years, and adolescents, as well as significant increases in high adiposity, predominantly in males and in children aged <5 years.
Sociocultural factors may also play a role in the differences observed between these males and females, suggesting that the girls may be influenced to remain thin by a greater concern with physical appearance, while boys may not necessarily regard overweight as a disadvantage in appearance and thus maintain higher caloric intake. The unique and significant increase in high adiposity in children aged <5 years in the midst of the economic crisis—in contrast to the other age groups—may also be a manifestation of sociocultural conditioning that prioritizes wellbeing of young children, ensuring that even in difficult circumstances, they receive special protection within the family and society.
Although genetic factors influencing development of obesity are also recognized,[29,30] results of this study lend support to the assertion by some authors that “obesogenic” environments favoring increased intake of high-calorie food combined with reduced physical activity are a fundamental cause of the current obesity epidemic. While many factors are involved, such environments tend to coincide with social changes brought about by economic and technological development.[31,32]
CONCLUSIONS
Trends in prevalence of excess weight and high adiposity in children and adolescents in Havana over a 33-year period generally coincided with nutritional transitions imposed by economic factors, declining during a period of economic crisis and scarcity, and rising as availability of food and transportation improved. The upward trend in prevalence of high adiposity was especially notable and significant in comparison to all previous values and to increases in all excess weight categories. Continued monitoring is needed as well as intersectoral interventions aimed at reducing potential health risks from these conditions.