ABSTRACT
Introduction Cerebrovascular diseases (CD) are a global health problem. They are the second and third causes of death in the world and in Cuba, respectively. Projections for year 2020 suggest they will continue to be among the main causes of death and disability, both in developed and developing countries. In 2006, the National Health System (NHS) presented its Public Health Projections in Cuba for Year 2015, which set the following specific goals for CD mortality reduction: overall mortality by 25%, female mortality by 30%, and hospital mortality by 30%.
Objective Analyze CD mortality in Cuba from 1970 to 2006, before and after implementation of the National Program for Cerebrovascular Disease Prevention and Control (NPCD-PC) to obtain a better understanding of the current situation, which may serve as the basis to meet the goals set for year 2015.
Methods CD mortality databases from the National Statistical Division of the Cuban Ministry of Public Health were used. The following variables were applied: sex, CD-related causes, and place of death. Crude and age-adjusted mortality rates were determined. Overall mortality, mortality by sex, years of potential life lost, hospital mortality, incidence, and prevalence were calculated.
Results Crude mortality rates showed a sustained increase within the time series under study; conversely, age-adjusted rates showed a decrease in mortality during the 1970s, were stable in the 1980s and 1990s and, finally, decreased since year 2000, when the NPCDPC program was started in the country. The male/female ratio increased slightly from the late 1990s until 2005; yet female mortality has shown a tendency to increase. Between 1993 and 2002, cerebral hemorrhage caused more deaths than the cerebral infarction; since then, this profile has reversed. CD-related years of potential life lost (YPLL) showed a decrease from 1970 to 1975, followed by a sustained increase through 1985, and a gradual decrease since 1990. Hospital mortality diminished steadily from 1990 to 1999 and has remained stable since year 2000. Even though there was greater CD incidence from 2000 to 2001, it has decreased since then. However, prevalence has increased slightly every year from 2000 to 2005.
Conclusion Although overall mortality and female mortality rates, in particular, increased following implementation of the NPCD-PC program, age-adjusted mortality, hospital mortality, and incidence diminished during the same period. Further study is recommended to determine specific actions required to achieve CD mortality reduction goals by 2015.
Keywords: Vascular diseases, stroke, cerebrovascular accident, CVA, intracranial hemorrhage, brain ischemia, cerebral infarction, cerebral hemorrhage, epidemiology, hospital mortality, mortality
INTRODUCTION
Cerebrovascular diseases (CD) are a global health problem. They are the second cause of death in the developed world, the first cause of adult disability and the second cause of dementia. [1] According to World Health Organization (WHO) data, 15 million people suffer a stroke every year; of these, 5.5 million die (10% of total deaths) and another 5 million are left with some permanent disability.[2] It is estimated that the 38 million days of healthy life lost in 1990 from stroke will become 61 million by 2020.[3]
In the last 20 years, developed countries have experienced a 29% decrease in the incidence of all types of stroke; and, with the exception of cerebral hemorrhage (CH), a 25% stroke mortality reduction.[4,5] Greater burdens of chronic disease are emerging in developing countries, and of cerebrovascular diseases in particular. These are coupled with serious burdens of infectious diseases, a pattern that is expected to continue until the year 2020. [6] Today, cardiovascular and cerebrovascular diseases cause twice the number of deaths as do HIV, malaria, and tuberculosis combined.[7]
Due to the aging of many populations in the world, projections for year 2020 seem to indicate that stroke will continue to be the second cause of death both in developed and developing countries. In terms of disability, it will be among the five major contributors to disease burden.[2] CD also imply huge economic burdens for health systems due to the resources needed to provide care for acute-phase patients and long-term care for survivors, with the concomitant social implications.[3]
At the same time, psychological and social changes associated with migration to urban or semi-urban areas or rapid urbanization of human settlements prompt changes in living conditions and lifestyles, including the adoption of harmful food consumption patterns and habits that facilitate development of chronic diseases. [8,9]
In Cuba, CD are the third cause of death. In 2006, there were 8,347 deaths by stroke, for a crude rate of 74.0 and an ageadjusted rate of 42.2 per 100,000 in the healthy population.[10] Moreover, according to estimates based on year 2000 data, CD are the fifth cause of years of healthy life lost (YPLL).[11] Although the greatest impact was felt by persons aged ≥65 years, CD were a major cause of premature mortality – 16.1 per 100,000 population in 2002 (last year of available data).[12]
CD are linked to habits, lifestyles, and risk factors that can be identified early and for which prevention and control measures can be implemented.[13-15] In Cuba, hypertension is the risk factor most associated with stroke. The Second National Survey on Risk Factors (2002) reported that 32.6% of the urban population aged >15 years suffered from hypertension.[16]
In 1999, the National Health System (NHS) of Cuba prepared the National Program for Cerebrovascular Disease Prevention and Control (NPCD-PC) aimed chiefly at contributing to reduction of CD morbidity and mortality over time (on a permanent basis, in the long term, and through five-year assessments) and space (nationwide, including all national health system units from family doctor-nurse offices to the tertiary care level.) The Program’s implementation was begun in January 2000.
The Program is intended to institute measures to meet its goals by focusing efforts on CD prevention, mainly to control risk factors (hypertension, diabetes mellitus, obesity, hyperlipidemias), change lifestyles (physical inactivity, tobacco use, alcohol use, poor nutritional habits), and improve medical care at all levels.
At the primary health care level, health promotion and disease prevention actions are developed, lifestyle modifications encouraged, and greater active screening of individuals at risk carried out. At the secondary and tertiary levels, the Program includes improving timely diagnosis and effective treatment. The latter requires progressive development of specialized services with modern technologies for treating CD patients, and multidisciplinary teams of health professionals to ensure prompt rehabilitation.[ 17]
In 2006, the National Health System (NHS) published its Public Health Projections in Cuba for Year 2015, issuing the following specific goals for CD mortality reduction: overall mortality by 25%, female mortality by 30%, and hospital mortality by 30%.[18]
The objective of this study is to discuss evolution of CD mortality in Cuba from 1970 to 2006, and before and after implementation of the NPCD-PC, to obtain a better understanding of the current situation, which can serve as a basis for attaining these goals.
METHODS
Cuban CD mortality data were reviewed from mortality databases of the National Statistical Division of the Cuban Ministry of Public Health, covering 1970 to 2006.[19-21] Their reliability was supported by the Cuban Complementary Statistical Information System (CSIS), which relies fundamentally on continuous registration methods and application of sampling polls, and has national coverage including medical statistics and records departments in all health units and institutions. Certification of controlled events for their entry and statistical processing is universal, and design and operation of statistical health data systems are based on quality statistical data concepts and attributes such as feasibility, reliability, relevance, and rationality.
Population data were supplied by the Center for Population and Development Studies of the National Statistical Office.[22] Variations in CD mortality were determined during the 35-year period (1970 to 2006), and during the specific period following implementation of the NPCD-PC in 2000.[17] Both crude rates and age-adjusted rates were employed, the latter by direct method, using as standard the Cuban population from the 1981 census. All rates are expressed per 100,000 population per year.[19,22]
Variables studied were: sex, causes of CD-related deaths, and place of death. Causes of death are grouped according to the International Classifications of Diseases (ICD). ICD-9[23] was used for data through 1999: hemorrhagic (430-432), occlusive (434.0- 434.9), and others (433.0-433.9 and 435-438); while the later version, ICD-10, was used for data from 2000 to 2006: hemorrhagic (I60-I62), occlusive ischemic (I63) and others (I67-I69).[24] CDrelated YPLL and hospital mortality were also calculated.
Figure 1: Crude Mortality from Cerebrovascular Diseases in Cuba, 1970-2006; Total and by Sex
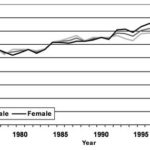
Source: National Statistics Division, Ministry of Public Health, Cuba Vertical line indicates start of the National Program for Cerebrovascular Disease Prevention and Control (NPCD-PC)
Figure 2: Age-Adjusted Mortality from Cerebrovascular Diseases in Cuba, 1970-2006
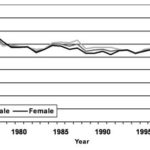
Source: National Statistics Division, Ministry of Public Health, Cuba Vertical line indicates start of the National Program for Cerebrovascular Disease Prevention and Control (NPCD-PC)
Figura 3: Crude Mortality from Cerebrovascular Diseases in Cuba by Place of Residence, 1995-2005
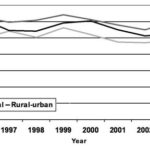
Source: National Statistics Division, Ministry of Public Health, Cuba Vertical line indicates start of the National Program for Cerebrovascular Disease Prevention and Control (NPCD-PC)
Figure 4: Deaths by Type of Cerebrovascular Disease in Cuba, 1990-2006
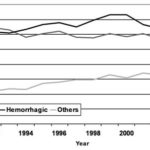
Source: National Statistics Division, Ministry of Public Health, Cuba Vertical line indicates start of the National Program for Cerebrovascular Disease Prevention and Control (NPCD-PC)
Coordination, implementation, supervision, and evaluation of the NPCD-PC have been conducted periodically and systematically through the Chronic Noncommunicable Diseases Division under the Ministry of Public Health’s Vice Ministry for Hygiene and Epidemiology. Provincial and municipal hygiene and epidemiology departments have been responsible for coordinating, implementing, supervising, and evaluating the NPCD-PC at these levels.
The Program’s efficiency has been measured by the number of activities planned and implemented yearly, including (1) coverage of care at institutions (community clinics, hospitals, maternity homes, nursing homes, and other health institutions in municipalities and provinces); (2) coverage through visits to CD specialist offices (at least one visit to a provincial hospital during the first two years after stroke, followed by municipal visits in the following three years; patients are referred to their health areas for follow-up and once a year they visit a provincial hospital); and (3) training (number of municipal and provincial health areas and institutions where training courses have been completed within a two-year period).
Evaluation of CD control is carried out on a semester and annual basis, and includes general indicators of effectiveness, impact, and quality of life, such as: incidence, prevalence (global and typespecific CD), mortality (crude and age-adjusted), and case fatality and hospital mortality rates.
The 1970 to 2006 mortality and 1995 to 2006 hospital mortality, incidence, and prevalence indicators were calculated. Graphic, time-series data were presented.
RESULTS
Figures 1 and 2 show mortality trends from 1970 to 2006. Crude rates evidenced a sustained increase between 1973 and 2000; starting in 2000, a slight decrease was observed through 2002, followed by another increase through 2005. The male/female ratio has increased slightly since the late 1990s through 2005 though female mortality has tended to increase. Analysis of age-adjusted rates revealed a mortality decrease in the 1970s, a stable period during the 1980s and 1990s, and finally a decrease since 2000.
Analysis of rate changes by decade found age-adjusted rate reductions of 31% (1970 to 1980), 3.6% (1980 to 1990), 3.4% (1990 to 2000), and 15.3% (2000 to 2006).
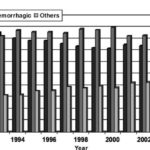
Figure 3 compares mortality rates in urban and rural areas since 1995, the year this data collection started. Rates for urban areas are higher and this trend has continued. Concerning type of stroke: cerebral hemorrhage (CH) caused more fatalities during the period of 1993 to 2002. This tendency has reversed since then, resulting in more deaths from cerebral infarction (CI) (Figure 4). This reversal has been more pronounced since 2003. Since then, CI mortality has been greater than CH mortality (Figure 5).
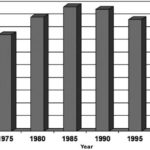
Figure 6 presents a five-year analysis of CD-related YPLL. The decrease from 1970 to 1975 was followed by sustained increases in the next two five-year periods. Since 1990, this indicator has been decreasing gradually.
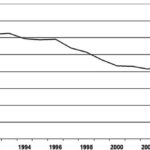
Hospital mortality from CD has diminished steadily from 1990 (the year this variable was first registered) until 1999, and has remained stable since 2000 (Figure 7).
Figure 5: Distribution of Deaths by Type of Cerebrovascular Disease in Cuba, 1990-2006
Source: National Statistics Division, Ministry of Public Health, Cuba Vertical line indicates start of the National Program for Cerebrovascular Disease Prevention and Control (NPCD-PC)
Figure 6: Years of Potential Life Lost (YPLL) from Cerebrovascular Diseases, 1970-2005
Source: National Statistics Division, Ministry of Public Health, Cuba Vertical line indicates start of the National Program for Cerebrovascular Disease Prevention and Control (NPCD-PC)
Figure 7: Cerebrovascular Diseases (CD) Hospital Mortality in Cuba, 1990-2006
Source: National Statistics Division, Ministry of Public Health, Cuba Vertical line indicates start of the National Program for Cerebrovascular Disease Prevention and Control (NPCD-PC)
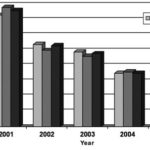
Figures 8 and 9 show the course of CD incidence and prevalence, respectively, since 1995, the year these data were first collected. Incidence increased from 2000 to 2001 and, except for a slight increase in 2005, has tended to decrease since then. However, prevalence showed slight yearly increases from 2000 to 2005.
DISCUSSION
In Cuba, a 30% CD mortality decrease during the 1970 to 1980 period was followed by a stable period until 2000, with minimal age-adjusted rate reductions. Ageadjusted mortality diminished again by 15% between 2000 and 2006.
This new decreasing trend may be due to a lower incidence rate and a higher survival rate among patients with stroke, or both. And contributing to these may have been results from the actions of the National Program for Cerebrovascular Disease Prevention and Control (NPCD-PC) implemented at various levels of the National Health System (NHS).
These include training of health professionals, health promotion efforts, and the use of clinical guidelines to improve patient care during acute phases, and in secondary prevention.
Lower mortality from 1970 to 1980 is explained, among other factors, by the evolution of the NHS. During that period, emphasis was placed on expansion of primary health care services and, particularly, on extension of the community polyclinic model throughout the country, as the main institution at this level.[25]
Between 1980 and 2000, an intense urbanization process took place, a result of migration from rural areas to cities.[26] This demographic trend is associated with increased CD risk.
A marked population aging tendency was observed during the entire study period. By year 2000, persons aged >60 years accounted for 13% of the Cuban population.[ 27] Life expectancy in Cuba reached 77 years in 2005,[10] and, while not the only risk factor, increased probabilities of developing chronic noncommunicable diseases including CD.[28]
A look at crude mortality rates, which describe the real risk of dying from a cerebrovascular disease, reveals an increase over time. Yet, age-adjusted rates show a decrease from 1970 through 2006. Such difference between the crude and adjusted rates once again points to the importance of age as a factor in the onset of CD.
In the case of morbidity, incidence rates have decreased, while prevalence rates have tended to increase. Many factors influence this including an under-reporting of stroke, as seen with hypertension – the main risk factor for stroke in Cuba. At the end of 2004, according to records of patients who had been screened and treated at the primary care level, 24.0% of the adult population was hypertensive. But the real figure should be higher, according to the 2nd National Survey on Risk Factors and Chronic Diseases, in which 33% of the sample was reported as hypertensive.[16]
These morbidity trends may also be related to the observed decrease in mortality and hospital mortality, consequently producing a larger number of stroke survivors.
Figure 8: Total, Male, and Female Cerebrovascular Disease Incidence in Cuba, 2000-2006
Source: National Statistics Division, Ministry of Public Health, Cuba Vertical line indicates start of the National Program for Cerebrovascular Disease Prevention and Control (NPCD-PC)
Figure 9: Total, Male and Female Cerebrovascular Disease Prevalence in Cuba, 1995-2006
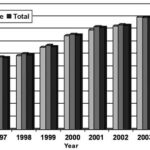
Source: National Statistics Division, Ministry of Public Health, Cuba Vertical line indicates start of the National Program for Cerebrovascular Disease Prevention and Control (NPCD-PC)
CONCLUSION
Although the overall CD mortality – and particularly mortality in women – showed increases after NPCD-PC implementation, decreases occurred in age-adjusted mortality, hospital mortality and incidence during the same period. These results suggest the need for more in-depth study of the national Program’s implementaton, leading to adoption of relevant actions to attain the Cuban National Health System’s goals for year 2015,[18]. In particular, there is a need to:
• Analyze generalization and adequate application of best clinical practices in CD management, including correct and updated utilization of recommended medications.
• Evaluate new needs for medical equipment required to support the NPCD-PC.
• Determine current availability of specialized CD hospital units and consider increasing their numbers in places where prevalence rates warrant.
• Assess training of health personnel in care of stroke patients and recommend additional training if required.
• Assess coverage and effectiveness of public awareness programs on CD prevention and stroke symptoms.
• Analyze female/male ratio increases observed.
• Analyze the higher urban mortality observed.
• Analyze behavior of cerebral hemorrhage, with an emphasis on the female population.
References

- Bejot Y, Benatru I, Rouauda O, Fromont A, Besancenot JP, Moreau T. Epidemiology of stroke in Europe: Geographic and environmental differences. J Neurol Sci. 2007; 262(1-2):86-8.
- Mackay J, Mensah GA. Deaths from stroke. In: The Atlas of Heart Disease and Stroke. World Health Organization. WHOLIS[Internet data base]. [Accessed on February 11, 2008]. Available from: http://whqlibdoc.who.int/ publications/2004/9241562768.pdf.
- Mackay J, Mensah GA. Burden from stroke. In: The Atlas of Heart Disease and Stroke. World Health Organization. WHOLIS [Internet data base]. [Accessed on February 11, 2008]. Available from: http://whqlibdoc.who.int/ publications/2004/9241562768.pdf.
- Rothwell PM, Coull AJ, Giles MF, Howard SC, Silver LE, Bull LM, et al. Change in stroke incidence, mortality, case-fatality, severity, and risk factors in Oxfordshire, UK from 1981 to 2004 (Oxford Vascular Study). Lancet 2004; 363:1925-33.
- Bénatru I, Rouaud O, Durier J, Contegal F, Couvreur G, Béjot Y, et al. Stable stroke incidence rates but improved case-fatality in Dijon, from 1985 to 2004. Stroke. 2006; 37:1674-9.
- Gaziano TA. Cardiovascular disease in the developing world and its cost-effective management. Circulation. 2005; 112(23): 3547-53.
- Gaziano TA. Reducing the growing burden of cardiovascular disease in the developing world. Health Affairs. 2007; 26(1):13-24.
- Impacto de las tendencias demográficas sobre los sectores sociales en América Latina. Boletín demográfico. Santiago de Chile: CELADE/CEPAL; 1996. [Accessed on December 24, 2007]. Available from: http://www.henciclopedia.org.uy/ autores/Filgueira/InfanciaAL.htm – 62.
- Castellanos PL. Perfiles de mortalidad, nivel de desarrollo e inequidades sociales en la región de las Américas: Programa de análisis de Situación de Salud. OPS/OMS; 1994.
- Ministerio de Salud Pública. Anuario Estadístico 2006. La Habana: Cuba; 2006. [Accessed on February 11, 2008]. Available from: http://www. sld.cu/sitios/dne/.
- Seuc Jo AH, Domínguez Alonso E, Fernández- Concepción O. Esperanza de vida ajustada por enfermedad cerebrovascular. Rev Cubana Hig Epidemiol. 2004; 42(3). [Accessed on December 20, 2007]. Available from: http://scielo.sld.cu/scielo. php?script.
- Ministerio de Salud Pública. Anuario Estadístico 2002. La Habana: Cuba; 2002. [Accessed on September 6, 2007]. Available from: http://www. sld.cu/sitios/dne/.
- Health in the Americas. Pan American Health Organization. Washington: PAHO; 1998. [Accessed on December 24, 2007]. Available from: http://www.paho.org/english/HIA1998/Health- Vol1.pdf.
- Hahn R, Tentsch S, Rothenberg R. Excess Deaths From Nine Chronic Diseases in the United States, 1986. JAMA. 1990; 264(20):2654-9.
- Pérez-Alonso A, Rubial-León A, García-Hernández J. Enfermedades cerebrovasculares. Selección de temas. OPS: La Habana; 1998.
- Instituto Nacional de Higiene y Epidemiología (INHEM). Informe de la 2da. Encuesta Nacional de Factores de Riesgo y Enfermedades Crónicas. La Habana: Cuba; 2002.
- Ministerio de Salud Pública. Cuba. Programa Nacional de Prevención y Control de las Enfermedades Cerebrovasculares. Resumed 2000;13(4):174-81. [Accessed on December 24, 2007]. Available from: http://www.cub-ops-oms.org/Proyecciones%20 para%20el%20%20015.pdf.
- Ministerio de Salud Pública. Cuba. Proyecciones para la Salud Pública de Cuba para el año 2015. [Accessed on February 11, 2008]. Available from: http://salud2015.sld.cu/facotes-relacionadoscon- el-ambiente/plonearticlemultipage.2006-03 -24.5255686058/enfermedades-cerebrovasculares.
- Ministerio de Salud Pública. Cuba. Anuarios Estadísticos de Salud 1970-2006. La Habana.
- Ministerio de Salud Pública. Cuba. Situación de Salud en Cuba. Indicadores Básicos. 2000. Rev Temas Estadísticas de Salud. [Accessed on December 20, 2007]. Available from: http://www.sld. cu/sitios/dne/buscar.php.
- Ministerio de Salud Pública. Cuba. Situación de Salud en Cuba. Indicadores Básicos. 2002. Rev Temas Estadísticas de Salud. [Accessed on December 20, 2007]. Available from: http://www.sld. cu/sitios/dne/buscar.php.
- Centro de Estudios de Población y Desarrollo de la Oficina Nacional de Estadísticas (ONE). La Habana, 2006. Available at: http://www.one.cu
- Organización Mundial de la Salud. Manual de la Clasificación Estadística Internacional de Enfermedades, Traumatismos y Causas de Defunción: basada en las recomendaciones de la Conferencia para la Novena Revisión. Organización Panamericana de la Salud; 1978. [Accessed on December 17, 2007]. Available from: http://bases. bireme.br/cgi-bin/wxislind.exe/iah/online/.
- Organización Mundial de la Salud. Actualización de la Clasificación Internacional de Enfermedades, Décima Revisión (CIE-10). Boletín epidemiológico. 2003 junio. [Accessed on December 17, 2007]; 24(2). Available from: Boletín Epidemiológico, Vol. 24 No. 2, junio 2003.
- De la Torre E, López C, Márquez M, Gutiérrez JA, Rojas F. El desarrollo del sistema nacional de salud de Cuba. In: Salud para todos sí es posible. Sociedad Cubana de Salud Pública. La Habana; 2005. pp. 35-93.
- Centro de Investigaciones de la Economía Mundial. Investigaciones sobre el desarrollo humano y equidad en Cuba, 1999. La Habana: Caguayo; 2000. p. 216.
- Ministerio de Salud Pública. Situación de salud en Cuba. Indicadores básicos 2000. La Habana, 2001. Tabla. Indicadores generales del país.
- Torres Vidal RM, Gran Alvarez M, Felipe Roque A. Enfermedad cerebrovascular. Repercusión en la mortalidad de la población cubana en la década de los 90. In: Cuba. Ministerio de Salud Pública. Temas Estadísticas de Salud. La Habana: Dirección Nacional de Estadísticas; 2002. pp.164-174.
THE AUTHORS
Miguel Angel Buergo Zuaznábar (Corresponding Author: mabuergo@infomed.sld.cu), specialist in internal medicine and neurology. Associate professor and researcher, Institute of Neurology and Neurosurgery, Havana.
Otman Fernández Concepción, specialist in neurology. Associate professor and researcher, Institute of Neurology and Neurosurgery, Havana, Cuba.
Giselle Coutín Marre, biostatistician, Health Tendencies Analysis Unit, Ministry of Public Health, Havana, Cuba.
Rosa María Torres Vidal, specialist in family medicine and biostatistics, master’s degree in population studies, Division of Statistics, Ministry of Public Health, Havana, Cuba.
Submitted: November 1, 2007
Approved for publication: February 25, 2008
MEDICC Review, Spring 2008, Vol 10, No 2


