INTRODUCTION
Basic science experimentation and clinical trials are the most robust sources of scientific evidence in medicine and health. Descriptive or observational studies, although lacking explanatory capacity per se, are also a legitimate type of research—moreover, one that is essential in epidemiology and public health for learning about health situations and shedding light on health system performance.[1]
Many efforts have been made recently to maximize quality of observational studies, significant among them the Strengthening the Reporting of Observational Studies in Epidemiology Statement (STROBE).[2] According to STROBE, prevalence studies—also known as cross-sectional studies—play a key role, especially when conducted rigorously enough to transcend merely quantitative aspects. Then, they permit evidence-based characterization of what is occurring in a population in a particular context in space and time, as well as development of useful judgments for optimizing health interventions by various actors.
Sampling procedures play a key role in observational studies; indeed, they are the bedrock of study quality. Sampling is one of the greatest Achilles’ heels in non-communicable chronic disease (NCD) risk factor surveillance, essential for NCD prevention and control.[3] Yet, a 2001 review of surveillance studies in the Americas,[4] based on a tool specifically created for assessing prevalence studies,[5] yielded disturbing results regarding sample quality.
This assessment tool was fairly comprehensive, covering 19 points related to various technical areas: stated objectives, sampling design, data collection and processing methods, communication of results, etc. Four sections focused directly on sampling itself.
The 2001 surveillance study review involved a literature search in three databases (PubMed, Medline, BIREME) for articles on hypertension prevalence in Latin American and Caribbean countries published in the two preceding decades, yielding 58 articles, 48 (83%) of which appeared after 1990. Sampling design was not explained in 26% of articles; in 31%, sampling was not probabilistic; in 74%, formulas used for calculation of point estimates were inconsistent with design; and in 90%, errors and confidence intervals were not computed in accordance with sample design. In fact, only one of the 58 articles met all quality criteria, and ten met none.
This study was replicated in 2012[6] and, while it did not include a detailed analysis of sampling quality, its results suggest little progress in this regard. In fact, over one third of reports published in the past ten years lack information on sampling error associated with hypertension prevalence estimates.
Conventional techniques to meet the demands of sampling theory traditionally have required highly complex and costly fieldwork. Bearing this in mind, as well as the sampling problems outlined above, researchers in the city of Cienfuegos, Cuba, developed an innovative sampling method for the third Cienfuegos NCD risk factor study in 2011, aimed at achieving an approach both rigorous and efficient.
When the first two cross-sectional surveys were conducted in Cienfuegos (1991 and 2001), statistically rigorous but thoroughly conventional sampling designs were used. The sampling procedure in 2011 was considerably more efficient, especially because it minimized the number of household visits required, saving time and resources without sacrificing classical criteria for rigorous sampling design, such as probabilistic selection. This sampling innovation was created by one of the authors of this study (LCS) and was applied successfully in the Cardiovascular Risk Factor Multiple Evaluation in Latin America (CARMELA) study.[7] This paper reporting on its replication in Cienfuegos is the first published description of the technical details of the solution.
The purpose of this article is to outline the different alternatives considered for selecting the sampling procedure for such descriptive studies and, in particular, to describe in detail the procedure used and its results concerning sampling.
IMPLEMENTATION
Context: NCD risk factor surveillance in Cienfuegos, Cuba Situated in the center of the island, with a population of nearly 150,000, Cienfuegos is one of Cuba’s most important cities. Population-based NCD surveillance, particularly estimation of prevalence of main NCD risk factors, was first conducted there in 1991 under the general framework of the Cienfuegos Global Project.[8] Two more surveys followed, one in 2001 and another in 2011, the subject of this article. This latter study was conducted under the aegis of the CARMEN multi-country studies, a PAHO initiative for a multifactoral approach to NCD risk factors—Cienfuegos was designated the demonstration site for Cuba.[9] In fact, Cienfuegos is the only Cuban city that has systematically conducted population-based surveillance of risk factor prevalence since the early 1990s, to inform programming for risk factor reduction. The studies were approved by the Medical University of Cienfuegos ethics committee
A distinguishing features of NCD risk factor surveillance in Cienfuegos—permitting reliable, accurate estimates—is its careful sampling design process. This was documented in the first large-scale report of national significance, published in 1993;[10] and the essential results of the 1991 and 2001 surveys were published internationally.[11,12] These Cienfuegos studies, structured around an open-access instrument, also exceeded quality standards for NCD surveillance, as evidenced in the 2001 and 2012 reviews of surveillance studies.[4,6]
The general sampling problem The study’s target population consisted of residents aged 15–74 in the urban zone of the Municipality of Cienfuegos. Studies of this type require analysis disaggregated by age group and sex, which in turn requires sufficiently large sample sizes for each of the 12 conventional groups: six ten-year age segments (15–24, 25–34, 35–44, 45–54, 55–64 and 65–74 years) and subgroups by sex for each age segment. The minimum desirable sample size calculated for each group was 180–200 subjects.[13]
Since, as is the case nearly everywhere, the Cienfuegos population pyramid is far from uniform, the general sample cannot be equiprobabilistic. Nevertheless, all subsamples in the respective groups should meet that criterion. In order to achieve sample sizes sufficient for more detailed analysis and assuming an appreciable number of nonresponses, we needed to select 240 subjects in each of the aforementioned sex and age groups.
Sampling design Cuba’s National Statistics Office has a master sample that is regularly used for a wide range of purposes.[14] For this third Cienfuegos survey, a multistage sample was designed with its first three stages based on the master sample. The sampling units in the master sample are census districts (first-stage or primary sampling units), areas within the districts (second-stage units) and, finally, census sections (third-stage units) within the areas. Each census section consists of approximately five contiguous dwellings.
According to 2002 census data,[15] the smallest group was that of men aged 65–74 (4% of the population) and each dwelling housed an average of 2.5 adults in the target population, so it was calculated that to obtain 240 subjects in that group, 2400 dwellings would be required, finally including all subjects in that group in the sample. The other 11 groups would each need a minimum of 240 subjects. Thus, the set of 2400 dwellings would be sufficient to obtain the entire sample.
On this basis, it was calculated that some 500 census sections in the population would be needed. The selection procedure followed in this initial phase ultimately yielded an equiprobabilistic sample of 511 sections; the probability of selection in the master sample for each of these sections was 0.058.
Using this initial sample, a two-stage selection process was used for the purposes of our study, selecting dwellings first and then the subjects themselves. The sections selected contained 2540 dwellings, from which the necessary 2400 were selected at random. At this point we had an equiprobabilistic sample of dwellings. As for the subjects residing in these dwellings, the respective individuals (approximately 240) were selected for each of the groups using a probabilistic method.
The conventional method for handling this process would have been to first conduct a census of the 2400 dwellings to learn their composition, draw up separate lists for each of the 12 sex and age groups and, finally, to randomly or systematically select 240 subjects from each of the lists. However, this theoretically simple procedure is extremely complicated in practice; the idea was to avoid conducting such a costly initial census and save the time required to make two visits to each household—the first to determine the age and sex of their residents and compile the lists, and the second to interview those selected.
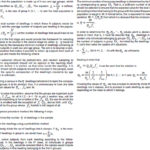
The approach used was devised by one of the authors of this article and, as far as we know, is original; broadly speaking, it involved first dividing the 2400 dwellings initially selected into 12 categories, randomly distributing the dwellings in these categories, whose sizes were determined by a system of equations. At this point, a sample of eligible people was selected in each dwelling. From each of these dwellings, subjects belonging to certain sex and age groups were selected, based on a rule established for each of the categories. For example, if the dwelling was in category 1, all eligible men were included (men aged 25–74); if the dwelling was in category 4, all women except those aged 35–44 were included, etc. This is only a general idea of how the mechanism operates. Fuller understanding of the procedure and its conceptual underpinnings can be obtained in the Appendix, describing a general solution to the problem, which was applied to the 12 sex and age groups corresponding to our case.
RESULTS
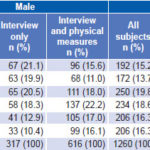
Weighting and corroboration of representativeness Having made the selection, the probability of inclusion was calculated for each person in the sample and, through its inverse, the weighting to use for overall estimates. Information was gathered in a two-step process. The first involved completing the general form; 2193 people gave informed consent and participated (933 men and 1260 women), distributed by age group and sex, as seen in Table 1, which shows that the desired sizes (180–200 subjects in each group) were obtained in most cells.
The second step involved physical measures (anthropometric, blood pressure and laboratory). A total of 1496 people (616 men and 880 women) were recruited and gave signed consent (Table 1). As can be seen, the second step had a high nonresponse rate: only 68.2% of subjects originally recruited appeared for physical measures (1496/2193). In such circumstances, possible differential impact of sample attrition must be analyzed.
The representativeness of the sample obtained was gauged through estimates of parameters for which census data were available. Results were highly satisfactory. For example, the 2002 national census, the last prior to the study, revealed that black and mestizo persons accounted for 27.9% of the population in the city of Cienfuegos. Dividing the sum of the weightings for all such persons by the sum of the weightings for all subjects in the sample yielded a ratio of 0.279, which coincides exactly with the census figure. Similar results were obtained for sex and educational level.
Table 1: Age and sex distribution of sample subjects

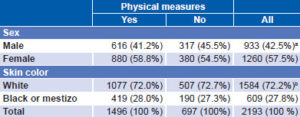
Comparison of interviewed subjects who had physical measurements with those who did not found no significant differences between the two (at threshold of p = 0.05) by sex or skin color (Table 2). However, age structure did differ between the two subsamples, as can be seen in Table 1. In fact, particularly marked differences can be observed at age extremes. For example, the group aged 15–24 years represents 14.3% of people for whom measurements were taken (214 out of 1496) and 20.2% (141 out of 697) of those for whom they were not. Among people over 64, the opposite held true: this group accounted for 17.7% (265 out of 1496) and 10.5% (73 out of 697) respectively. The difference in age distribution between subgroups with and without physical measurements was statistically significant (p <0.001).
Table 2: Sex and skin color distribution (%) in subsamples with and without physical measures

aχ2(1) = 3.60, p = 0.06 bχ2(1) = 0.13, p = 0.72
In principle, this result constitutes a study weakness, since it could bias results for hypertension. While it is impossible with available data to determine the degree of potential bias, a complementary analysis was done that consisted of estimating some prevalence rates related to variables measured in the first step (physical activity, smoking and educational level), independently using two samples: one consisting of subjects for whom measurements were taken in the second step and the other, of subjects for whom information was derived from self-report at interview in the first step.
The estimates were very similar [data not shown] for three parameters, suggesting that differences in age composition in these two subsamples might not affect overall results related to anthropometry and other variables not clearly related to age. However, blood pressure figures were likely overestimated to some degree, due to overrepresentation of older subjects in the group that appeared for measurement of this variable. In fact, the average age in this second group was approximately 46 years, while in the first group, it was only 41. Consequently, overall estimated hypertension prevalence for Cienfuegos in this study could be somewhat higher than true prevalence.
LESSONS LEARNED
The third survey of NCD risk factors in Cienfuegos (2011) was conducted using a probabilistic (not self-weighted) sample obtained through a five-stage selection process: districts, areas, sections, dwellings and subjects. The first three stages employed the procedures used for the master sample in the selection process, and the last two were specific to this study, using a novel approach that greatly facilitated field work and yielded substantial resource savings without compromising the probabilistic nature of the general sampling procedure.
The novelty of the sampling procedure used calls for careful study of its features. The detailed explanation of the method used in these stages is a resource that can be used in future to solve one of the most frequent problems in this type of research. The statistical rigor and efficiency of the procedure make it a useful tool for improving accuracy and reliability of NCD risk factor prevalence estimates in and beyond Cienfuegos.
APPENDIX
General Theoretical Solution for Two-stage Selection of Subjects Based on a Cluster of Dwellings


